Summary
Understanding the balance between new and expansion Annual Recurring Revenue (ARR) is critical for SaaS companies at every stage. This mix not only dictates growth strategy but also significantly influences how venture capital firms assess a company’s health and potential. Discover the ideal ARR composition for your stage and why mastering both new customer acquisition and existing customer growth is key to sustainable success.
Key Takeaways
- The ideal mix of new versus expansion ARR changes significantly as a SaaS company matures, shifting from new customer acquisition to greater reliance on existing customer expansion.
- Early-stage SaaS companies primarily drive ARR from new customer acquisition due to smaller customer bases and fewer product offerings.
- Late-stage SaaS companies prioritize expansion ARR because it’s more cost-effective to upsell existing clients and they have a larger customer base with multiple products.
- Investors scrutinize expansion ARR alongside other metrics like net revenue retention to evaluate a SaaS company’s ability to grow its existing customer base efficiently.
- SaaS companies with over $200M ARR can see as much as two-thirds of their growth originating from existing customer upsells and cross-sells.
SaaS Metrics – New versus Expansion ARR
The mix of new versus expansion ARR is one of the most commonly viewed metrics by venture capital firms. Early-stage SaaS companies with Series A or B funding typically generate most of their ARR from new customer acquisition and very little from expansion. Later-stage SaaS companies with Series D or E funding that are pre-IPO have a more balanced level of growth from both new ARR and expansion ARR.
What is the ideal mix of new vs expansion ARR for a SaaS company?
- $0-$1M – 99% new ARR and 1% expansion ARR
- $1-$5M – 95% new ARR and 5% expansion ARR
- $5-$10M – 80% new ARR and 20% expansion ARR
- $10-$25M – 65% new ARR and 35% expansion ARR
- $25-$50M – 60% new ARR and 40% expansion ARR
- $50-$100M – 55% new ARR and 45% expansion ARR
- $100M-$200M – 45% new ARR and 55% expansion ARR
- $200M+ – 35% new ARR and 65% expansion ARR
New versus Expansion ARR for Early-Stage SaaS
Early-stage startups typically have a smaller customer base, so there is less of an opportunity to upsell existing accounts. Furthermore, most startups only have a single product so there is not much to cross-sell beyond the core product. As a result 80-90% of recurring revenue is new ARR and only 10-20% is expansion ARR.
New versus Expansion ARR for Late-Stage SaaS
Later-stage companies typically have greater market penetration and a larger customer base. These more mature organizations also have developed multiple product offerings. It is usually far less expensive to upsell an existing account than to acquire a new customer. As a result, later-stage SaaS companies place a greater emphasis on expansion strategies.
Expansion ARR Importance to Investors
Along with expansion ARR, investors review SaaS metrics like product attach rates, net revenue retention, gross revenue retention, and customer cohort analysis to understand how effective SaaS companies are at growing their existing customer base.
These metrics are so important to venture capital and growth equity firms that many of them survey and benchmark their portfolio companies annually to understand what the top and bottom quartile performance looks like as well as the median. In the remainder of this article we will share recent ARR expansion benchmarks from five prominent investors:
- Key Bank Capital Markets
- Sapphire Ventures
- Emergence Capital
- OpenView Partners
- Iconiq Capital
Each of the different venture capital firms looked at a different mix of SaaS and cloud providers with varying ARR ranges from < $1M to over $200M.
New versus Expansion ARR Benchmarks by Revenue Range
Private Equity & Venture-Backed – $100M or Less
Key Bank & Sapphire Ventures Study
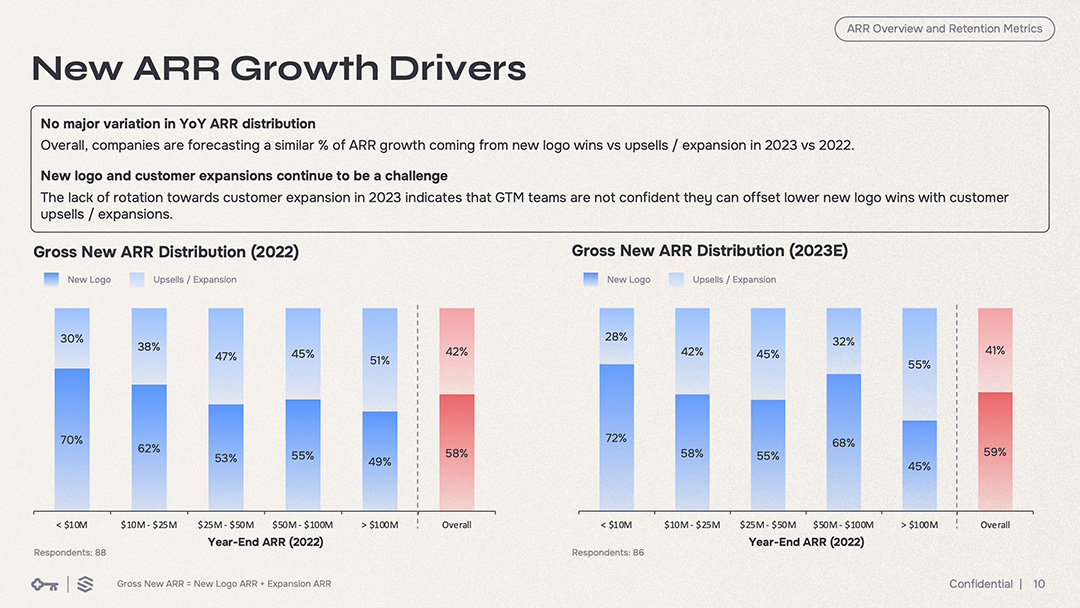
Key Bank Capital Markets and Sapphire Ventures conduct an annual survey of private SaaS companies about their historical and projected operating metrics. The 2024 survey had over 100 respondents, the majority of which were below $100M in ARR with a mix of venture and private-equity backed firms. Survey respondents primarily hailed from segments such as horizontal business applications, Vertical SaaS, fintech, infrastructure, and security.

The KBCM/Sapphire survey provides two different types of new versus expansion ARR benchmarks. The first cut charts the mix of new and expansion by ARR range. Consistent with the other studies the survey found that as SaaS companies grow in size ARR growth comes from an increasingly even mix of new and expansion ARR. Early-stage companies have a 70/30 split while later-stage companies are 50/50.
The second view analyzes the mix of new vs expansion in the context of ARR growth rate. Companies that grew ARR 30% or more were more reliant on new customer acquisition. Best-in-class SaaS companies generated 2/3 of ARR from new business and 1/3 from expansions.
Horizontal and Vertical SaaS Companies – $50M or Less
Emergence Capital
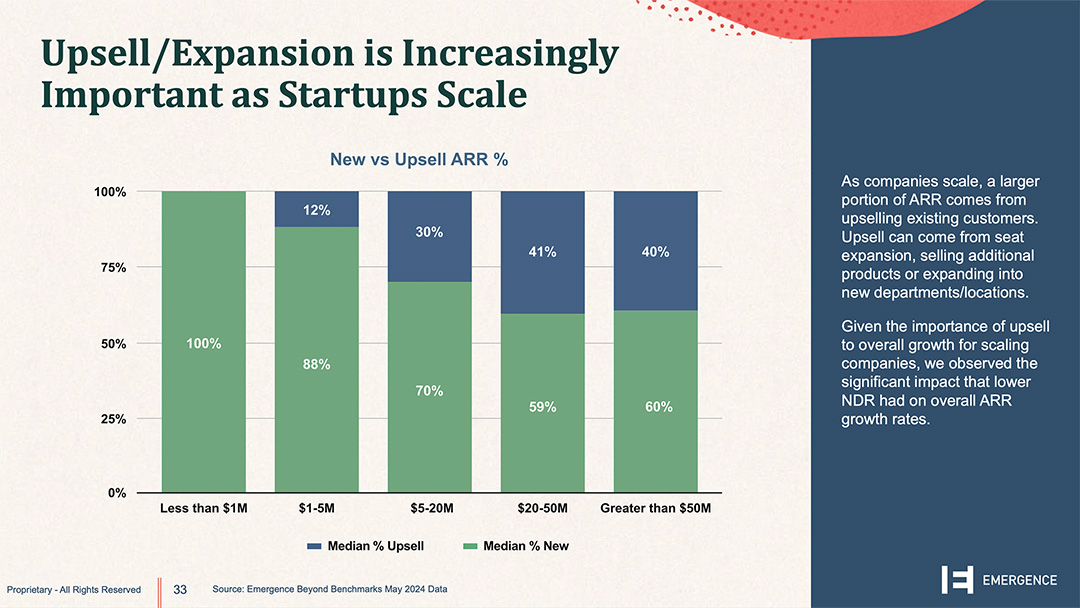
In its inaugural Beyond Benchmarks report, Emergence Capital surveyed over 600 SaaS companies about fundraising, generative AI investments, and operating metrics. The report includes new versus expansion ARR benchmarks for the 600 companies. Emergence primarily surveyed companies with less than $50M ARR primarily from segments such as horizontal business applications, vertical SaaS, fintech, cybersecurity, and infrastructure.

Emergence’s survey results were consistent with the others. Smaller, earlier-stage SaaS companies derive most of their ARR from new customer acquisition. For example, survey respondents with $1-$5M in revenue had 88% new and 12% expansion ARR. As the companies grow, the mix of new versus expansion ARR shifts to a more even balance. SaaS companies with over $50M in ARR had a 60/40 split of new to expansion ARR.
Annual Recurring Revenue
Ordway’s Online Guide
Learn more about ARR movements (expansions, contractions, churn) and whether to include monthly plans, usage-based pricing, and professional services.
Early Stage SaaS Companies – $20M or Less
OpenView
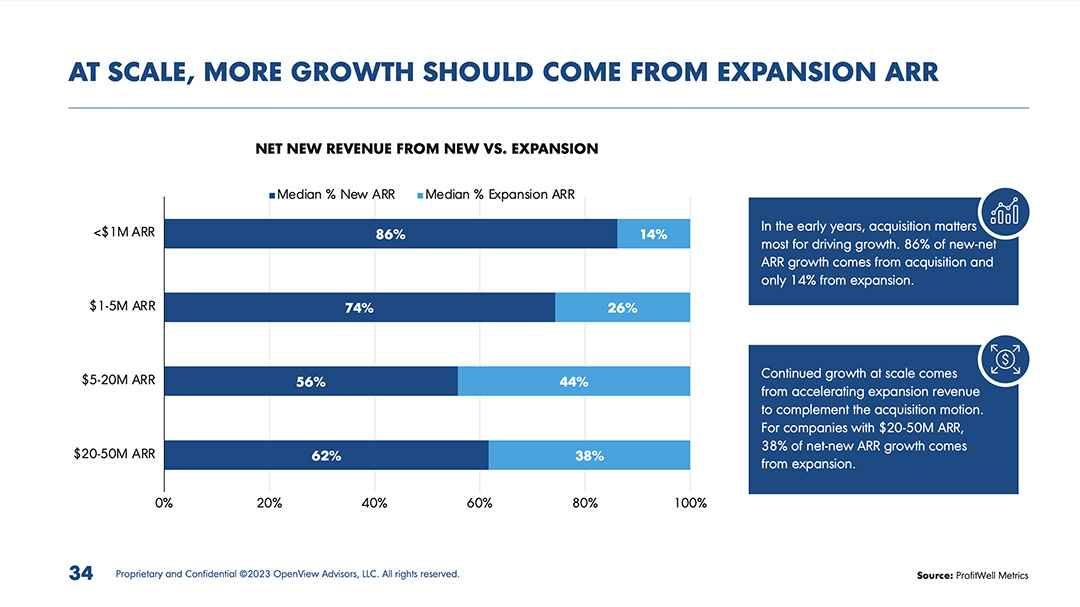
In its 2023 SaaS Benchmarks Report, OpenView collected data on a few dozen SaaS metrics, including new versus expansion ARR benchmarks. OpenView’s benchmarks focused on smaller SaaS companies, with 80% of survey respondents having less than $20M in ARR. The report includes a nice mix of geographically distributed companies. About half were from the US. Another quarter were from Europe. The remainder were from Canada, Israel, and other countries.

In general, OpenView’s ARR benchmarks correlated with the other survey results. Smaller, earlier-stage companies generate the majority of ARR from new customer acquisition. OpenView found that SaaS companies with less than $1M in ARR generate 86% of ARR from new business and 14% from expansion of existing customers. SaaS companies with $20-$50M in revenue had a more even balanced mix of growth from new accounts (62%) and upsell/cross-sell (38%).
Later Stage SaaS Companies – $100-$200M and Beyond
Iconiq Capital
Iconiq Capital published a study on the New Era of Efficient Growth in August 2023 which studied 96 B2B SaaS companies. Iconiq’s study included a mix of private and public companies targeting SMBs, mid-market, and enterprise accounts. The types of SaaS companies surveyed differs from the other studies with a greater percentage of respondents from the operations, GTM, infrastructure, security, and consumer segments.
Much like the other venture capital firms, Iconiq included new versus expansion ARR benchmarks by size of company. As expected, the balance of new versus expansion ARR grows more balanced over time. Perhaps, most interesting about Iconiq’s data is that it extends to larger SaaS companies in the $100M+ range. SaaS companies in the $100-$200M ARR range have an even mix of new and expansion ARR, but as they surpass $200M the reliance on upsell/cross-sell grows even more prominently. Iconiq found that companies with $200M+ ARR generate 2/3 of growth from existing customers and only 1/3 from new logos.
Iconiq also trended the ARR mix over a four-year time horizon. During the growth-at-all-costs period and Covid, a higher percentage of ARR (51%) came from new customer acquisition. As interest rates rose and the SaaS market went into a downturn in 2021, the mix shifted more than 10 points as companies focused more on upselling existing accounts. The percentage of ARR from new logos rebounded slightly in 2022 and early 2023 but still fell short of the pandemic levels.
Historical Trends in New versus Expansion ARR
Iconiq also trended the ARR mix over a four-year time horizon. During the growth-at-all-costs period and Covid, a higher percentage of ARR (51%) came from new customer acquisition. As interest rates rose and the SaaS market went into a downturn in 2021, the mix shifted more than 10 points as companies focused more on upselling existing accounts. The percentage of ARR from new logos rebounded slightly in 2022 and early 2023 but still fell short of the pandemic levels.
Conclusion
Ultimately, the journey of a SaaS company’s growth is reflected in the evolving relationship between new and expansion ARR. While initial success hinges on robust new customer acquisition, sustainable, efficient growth is increasingly driven by effectively expanding existing accounts. Strategic investment in both areas, tailored to the company’s maturity, is paramount for long-term success and strong investor confidence.
ARR Reporting Software
from Ordway
Track new, expansion, contraction, renewal, and churn ARR. Segment ARR by product line, geographic region, and legal entity. Report on ARR growth rates.
Frequently asked questions
What’s the difference between New ARR and Expansion ARR?
New ARR comes from new customers; Expansion ARR is added recurring revenue from existing customers via upsells, cross-sells, seats, or usage.
What’s a healthy New vs Expansion ARR mix?
Early-stage skews to New ARR (e.g., 70/30). As scale grows, Expansion can rise to 40–60%+ in strong NRR businesses; mix varies by segment and model.
How do benchmarks vary by go-to-market?
PLG/usage-led firms often see higher Expansion ARR due to consumption and seat growth; sales-led or enterprise may retain higher New ARR share initially.
Why does Expansion ARR matter for efficiency?
Expansion leverages existing relationships, driving higher NRR, better CAC efficiency, and shorter payback versus pure new logos.
How can I improve both New and Expansion ARR?
For New: sharpen ICP, channels, and win rates. For Expansion: compelling add-ons, tier fences, success/QBR motions, and usage nudges.
You May Also Like
 Offering Investors Better Insights on Growth
Offering Investors Better Insights on Growth
 7 Key Steps to Accurately Calculate ARR for Usage-Based Pricing Models
7 Key Steps to Accurately Calculate ARR for Usage-Based Pricing Models
 How to Calculate ARR for Usage-Based Pricing


