TL;DR: What You’ll Learn About Revenue Retention
Gross Revenue Retention (GRR) is a vital metric for SaaS companies, revealing how effectively they retain recurring revenue from existing customers over time. This metric specifically tracks revenue lost due to churn or downgrades, offering a clear snapshot of customer loyalty and product value. Understanding your GRR is crucial for assessing business health, attracting investors, and identifying areas for improvement in customer satisfaction. A healthy SaaS business typically retains 85-95% of its recurring revenue year-over-year.
Essential Insights on Maximizing Customer Value
- Gross Revenue Retention (GRR) measures the percentage of recurring revenue a SaaS company retains from its existing customer base, exclusively accounting for churn and contractions.
- A healthy SaaS business generally aims for a GRR between 85-95%, with top-tier companies often achieving 95-100%.
- Low GRR rates (below 85%) can indicate underlying customer satisfaction issues stemming from product quality, service problems, or unmet expectations.
- GRR considers only churn and downgrades, while Net Revenue Retention (NRR) additionally includes revenue expansions like upsells and cross-sells, enabling NRR to exceed 100%.
- While various terms like ‘Dollar-Based Gross Retention Rate’ exist, they typically refer to the same core metric, making it essential to understand the calculation method when comparing companies.
What Exactly is Gross Revenue Retention?
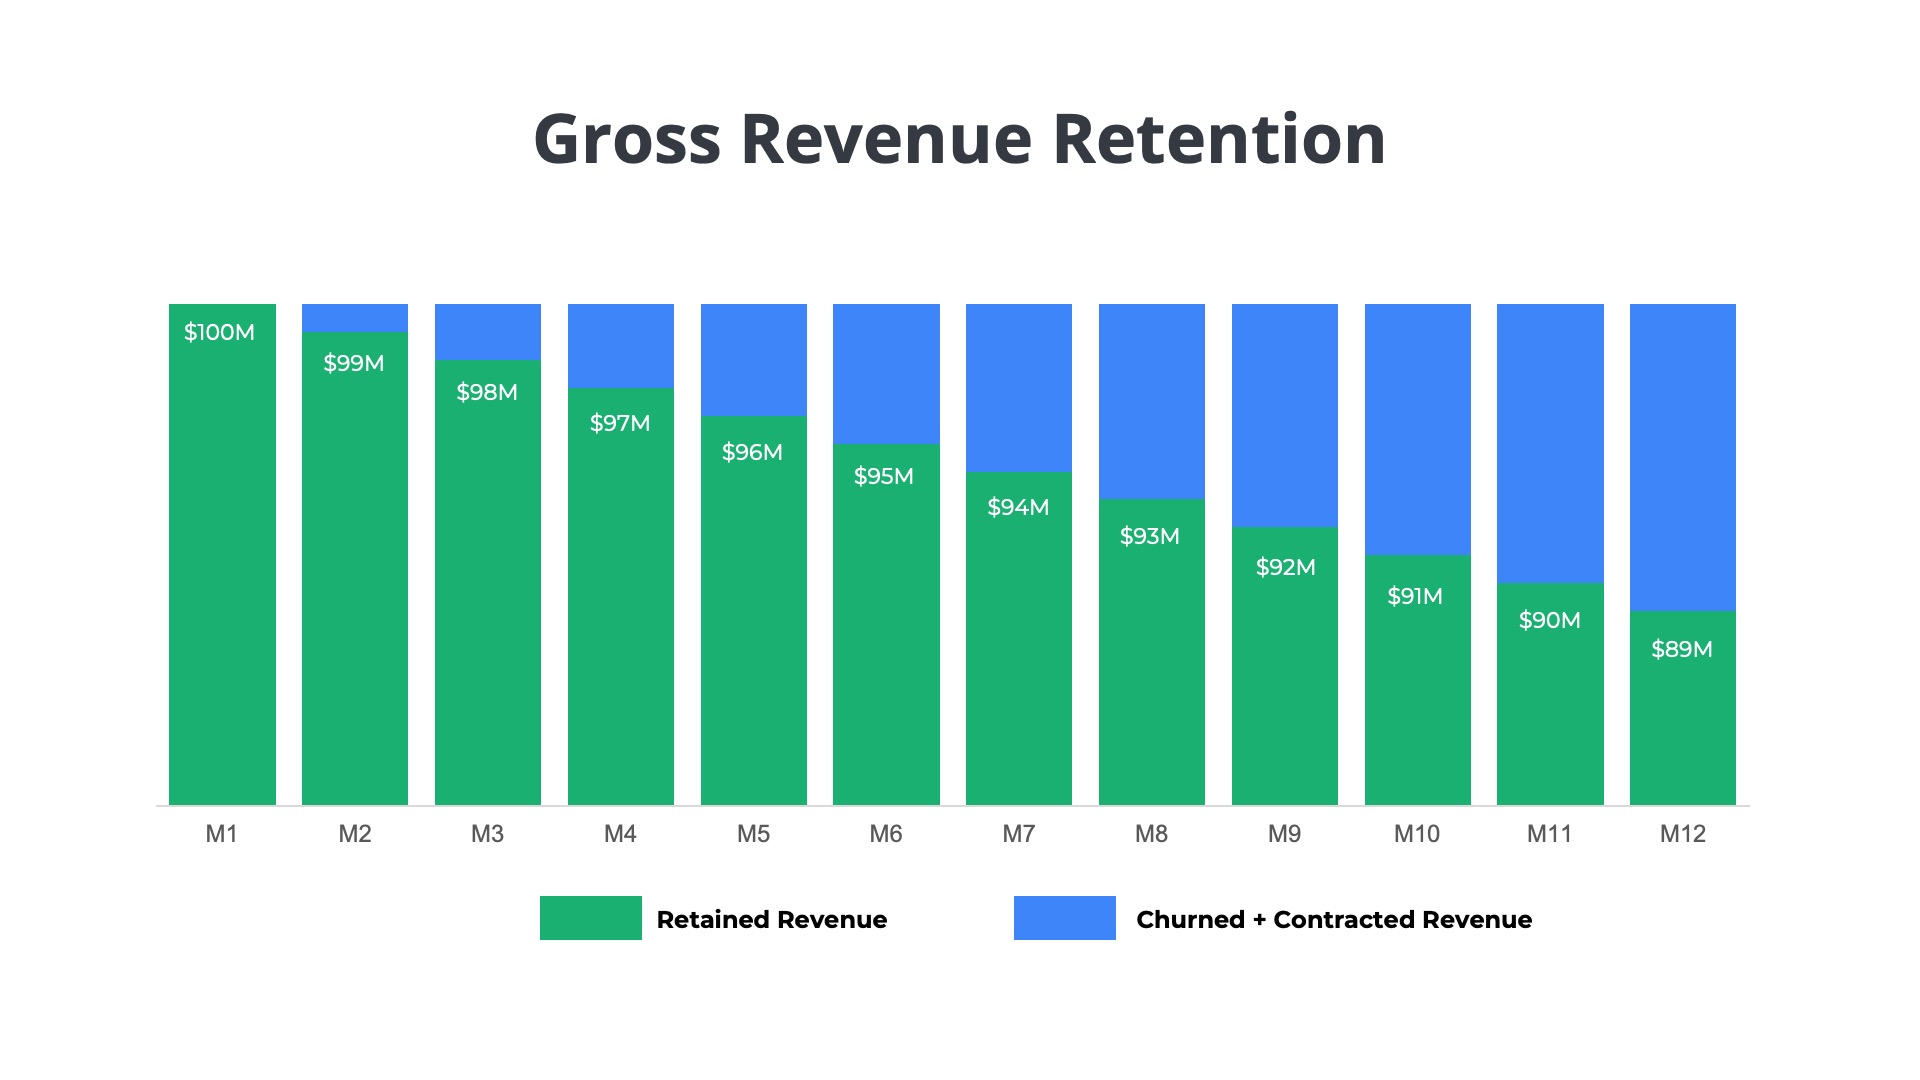
Gross Revenue Retention (GRR) is one of the key metrics that helps investors understand how much of the recurring revenue a particular SaaS company is retaining over time. Specifically, it measures the amount of recurring revenue ($x) generated from a specific group of customers (n) in a baseline year (e.g. year 1) and how much of that revenue ($x) is retained over the subsequent year (e.g. year 2) from that same group of customers (n).
It is highly unlikely that 100% of the revenue generated in year 1 will be retained in year 2. In any given year, some customers will either cancel their contracts or decrease their spending. A healthy SaaS business should retain 85-95% of its recurring revenue year-over-year.
Consider an example to understand better what gross retention measures. Suppose a SaaS company had $10M in revenue from a group of 1,000 customers on December 31st of last year (year 1). Gross Revenue Retention would measure how much of the original $10M would be retained on December 31st of this year (year 2) and not lost to churn. Suppose 50 of the 1,000 customers did not renew their subscriptions and another 50 downgraded services in year 2. The result might be that only $9M of the original $10M was retained. In this case, the Gross Revenue Retention rate would be 90% ($9M/$10M).
Frequently Asked Questions
In this guide we will answer many of the most frequently asked questions about Gross Revenue Retention including:
Why is Tracking Customer and Revenue Retention Crucial for Business Growth?
SaaS is a subscription business model. Investors considering purchasing stock or providing venture capital to a subscription business will want to understand if the company is able to retain customers over a multi-year period.
A healthy SaaS business should be retaining its customers year-over-year and growing the associated revenues over time. If a high percentage of customers are not renewing their contracts or downgrading their services, it is indicative of a larger problem and an unhealthy business. If gross retention rates are low (below 85%) then the SaaS company may have a customer satisfaction problem that could be a result of poor product quality, technical outages, or incorrect expectations set during the sales process.
What’s Considered an Excellent Gross Revenue Retention Rate?
A gross revenue retention in the 85-95% range is considered good. Best-in-class companies achieve 95-100%. Below-average performers have gross revenue retention below 85%. The ability to retain tends to vary with company size and maturity. Larger SaaS companies that are $100M+ in annual recurring revenue tend to have higher retention rates in the mid-to-high nineties. Smaller SaaS companies that are still developing an understanding of their ideal customer profile will have lower gross revenue retention rates in the low 90s or high 80s.
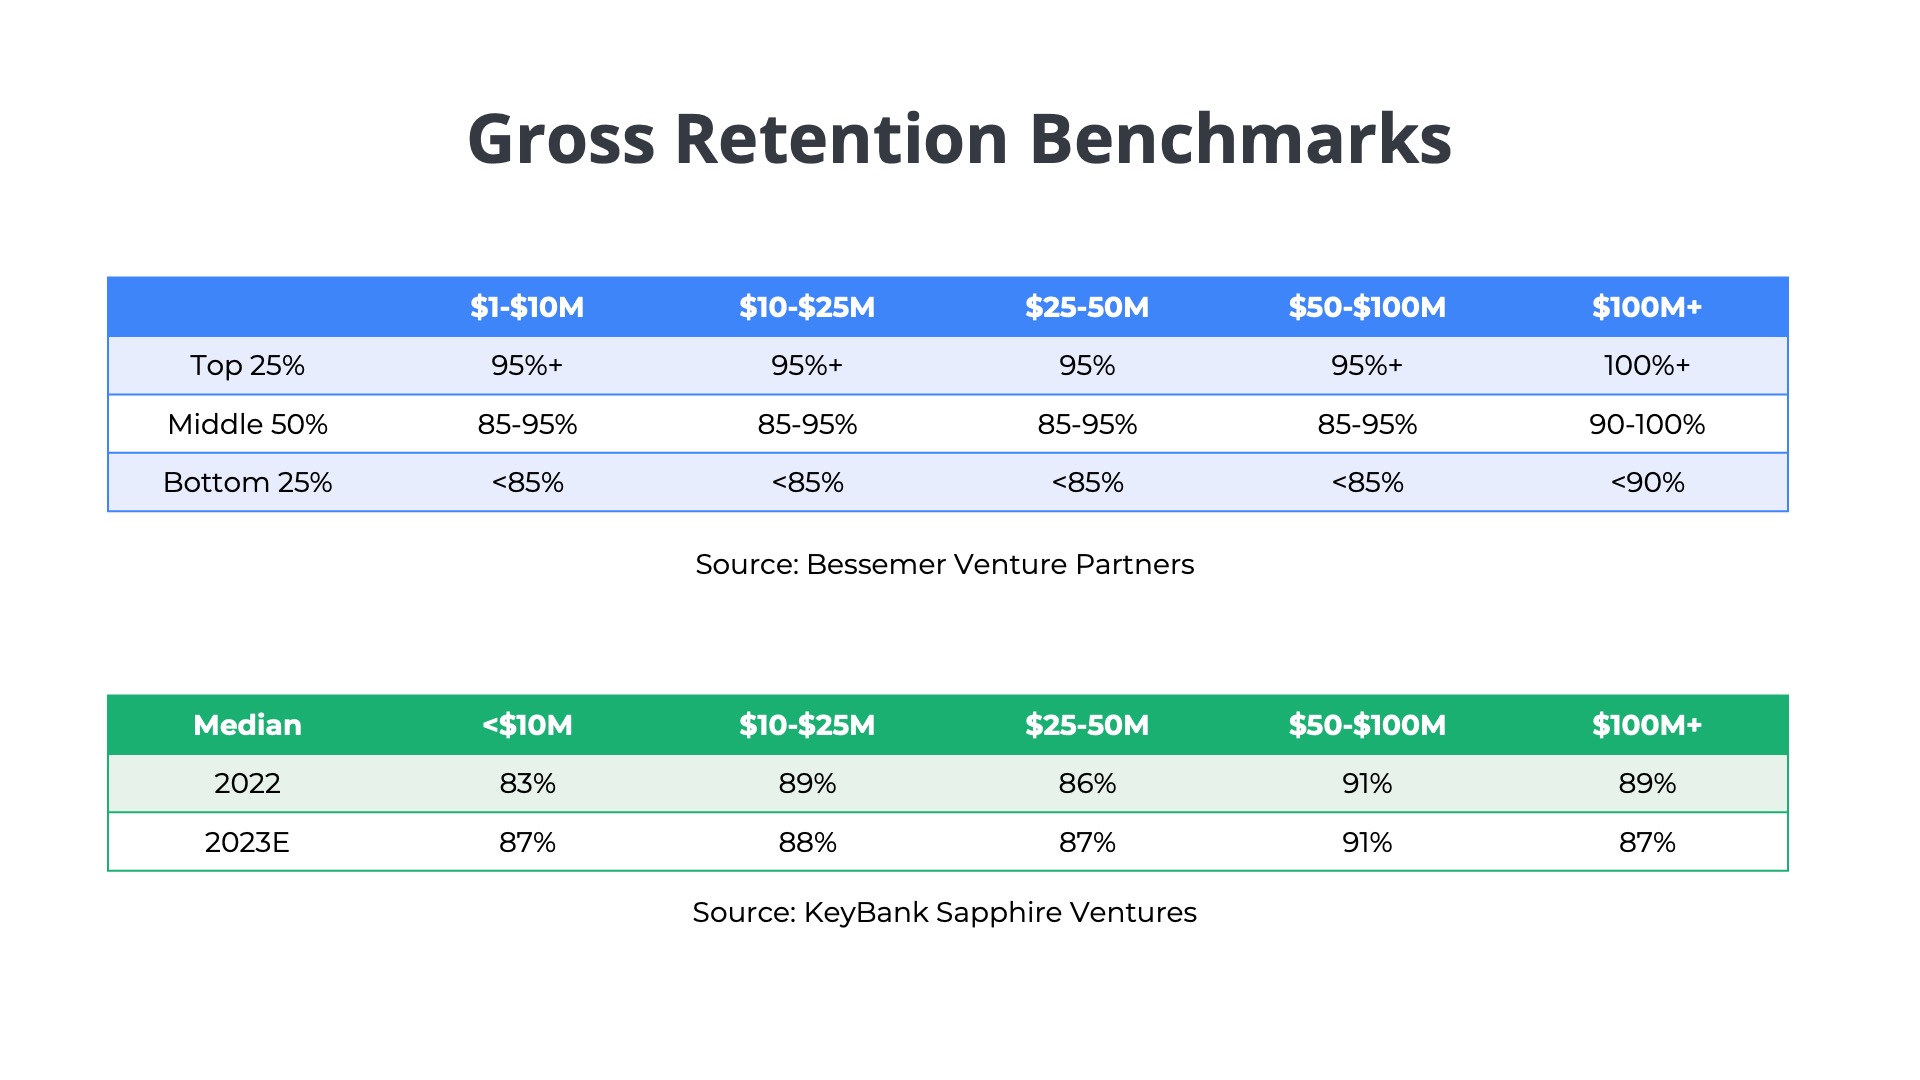
Learn more about SaaS benchmarks in the Bessemer Venture Partners guide and the KeyBank/Sapphire Ventures annual study.

Subscribe to our Newsletter
Delivered once per month. Get the latest on SaaS metrics, revenue recognition, pricing strategies.
Which Revenue Streams are Part of Gross Retention Calculations?
Churn and Contraction, but not Expansions
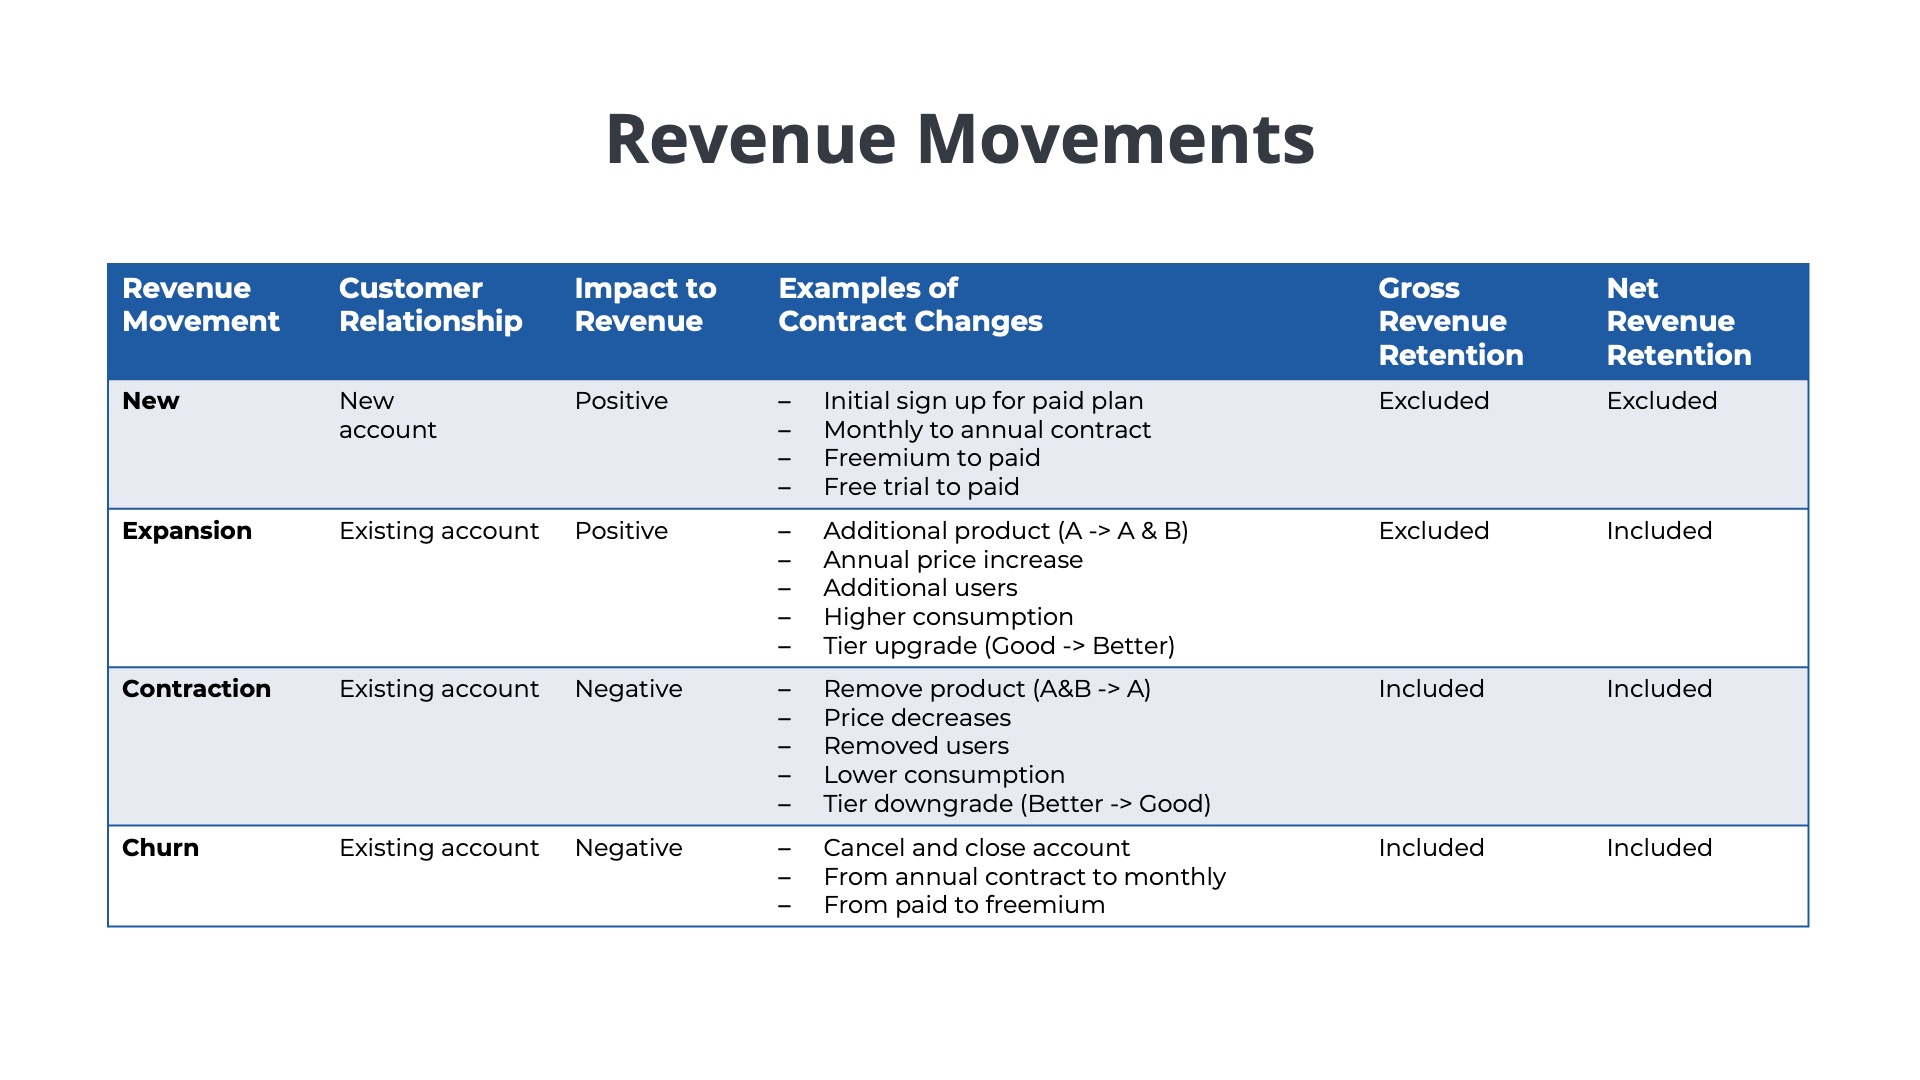
Gross Revenue Retention measures the impacts of “churn” and “contractions” on a specific group of customers. Churn could be a result of customers canceling their contract or downgrading from a paid to a freemium version of the service. Contractions are the result of customers reducing their spend with the SaaS company. For example, a customer may have been using three different products but scaled down to just one. Or the customer may have purchased subscriptions for 100 paid users in the prior year but contracted to just 50 paid users.
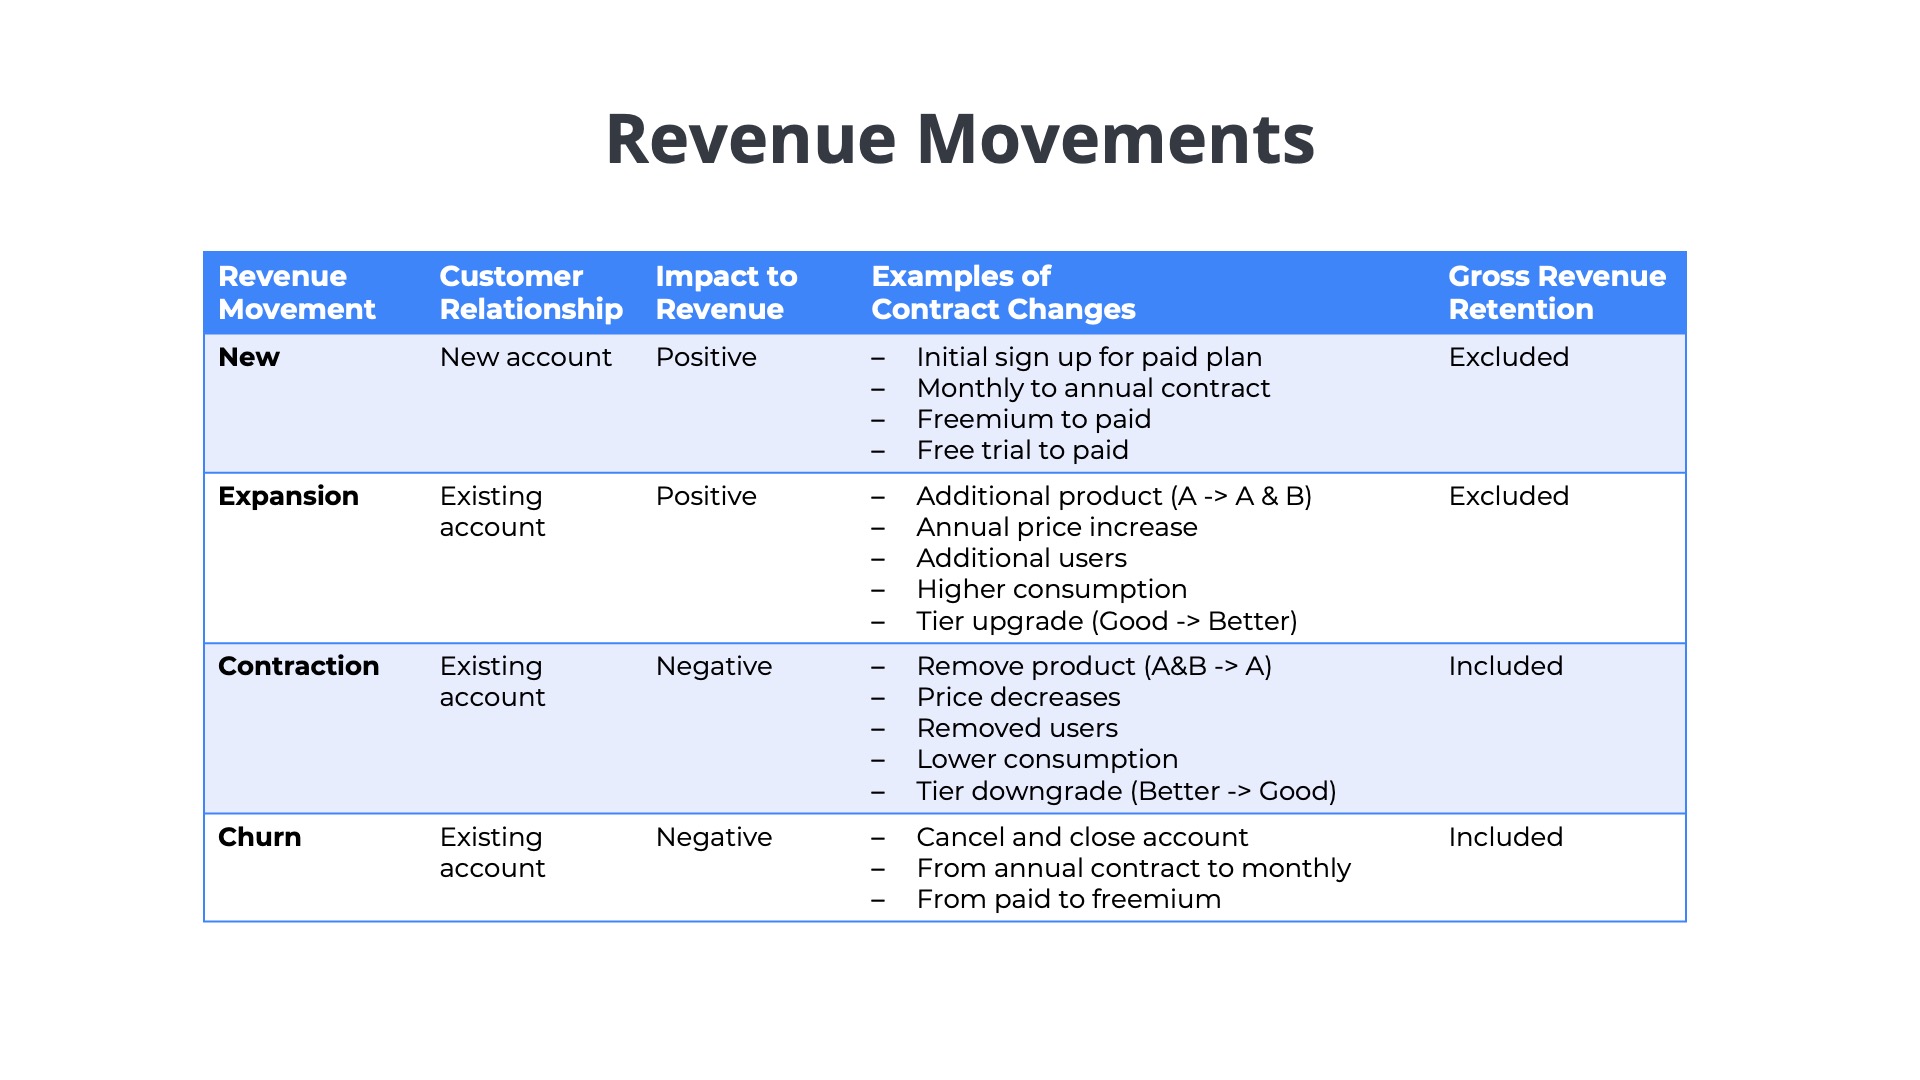
Gross Revenue Retention does not take into account the revenue “expansions” from the customer base. Expansions are increases in revenue generated from upsells, cross-sells, or price increases. For example, a customer may have only been using one product but expanded to use two or three products. Alternatively, the customer may have only purchased 50 paid seats in a prior year but increases to 100 paid seats in the following year.
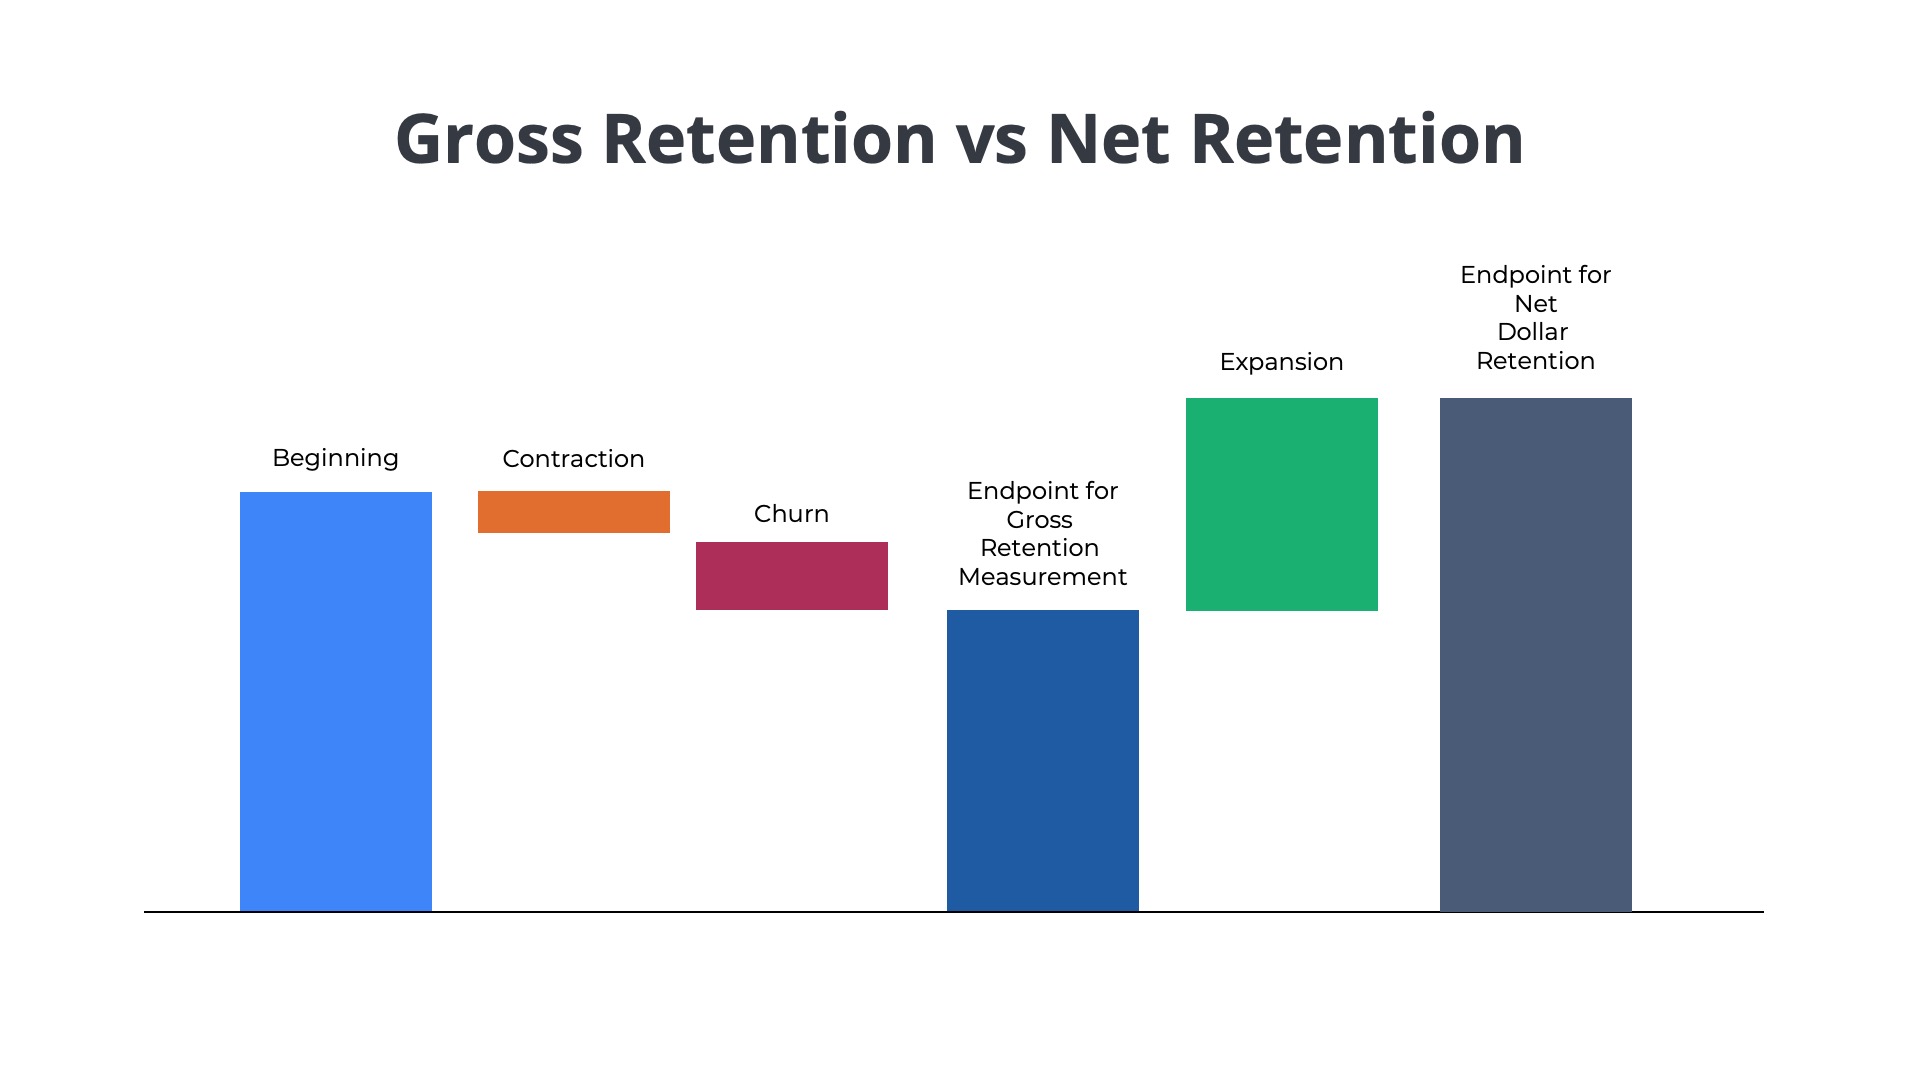
Comparing Gross Revenue Retention vs. Net Revenue Retention: Key Distinctions
Another closely related metric is Net Revenue Retention. Net Revenue Retention measures the change in revenue for a customer group, including expansions, churn, and contractions. Gross Revenue Retention only includes churn and contractions. A healthy SaaS business will generate more expansion revenue than it loses in churn and contractions, resulting in an overall “net” increase in revenue.
For example, suppose that a SaaS company generates $10M from 1,000 customers by December 31st of last year (year 1). This year (year 2), the company churns/contracts a total of $1M. The company’s Gross Retention is 90% ($9M/$10M). However, the SaaS company also upsells/expands a total of $1.5M to the base of 1,000 customers. As a result, the overall net change in revenue among the group of 1,000 customers is $0.5M. The total revenue generated in year 2 will be $105M ($100M + $0.5M). The Net Revenue Retention would be 105% ($10.5M/$10M).
What’s the Maximum Revenue Retention Rate for SaaS Businesses?
Gross Revenue Retention can never be higher than 100%, because it only measures the impacts of churn plus contraction and not expansion. The best a company could do is retain 100% of the revenue from its install base on a year-over-year period.
However, net revenue retention is expected to be greater than 100% because it includes the impacts of expansion revenue. Net revenue retention has no theoretical limit. It is common for high-growth companies to experience 120% or 130% net retention. SaaS CEOs aspire to achieve 200% net retention.
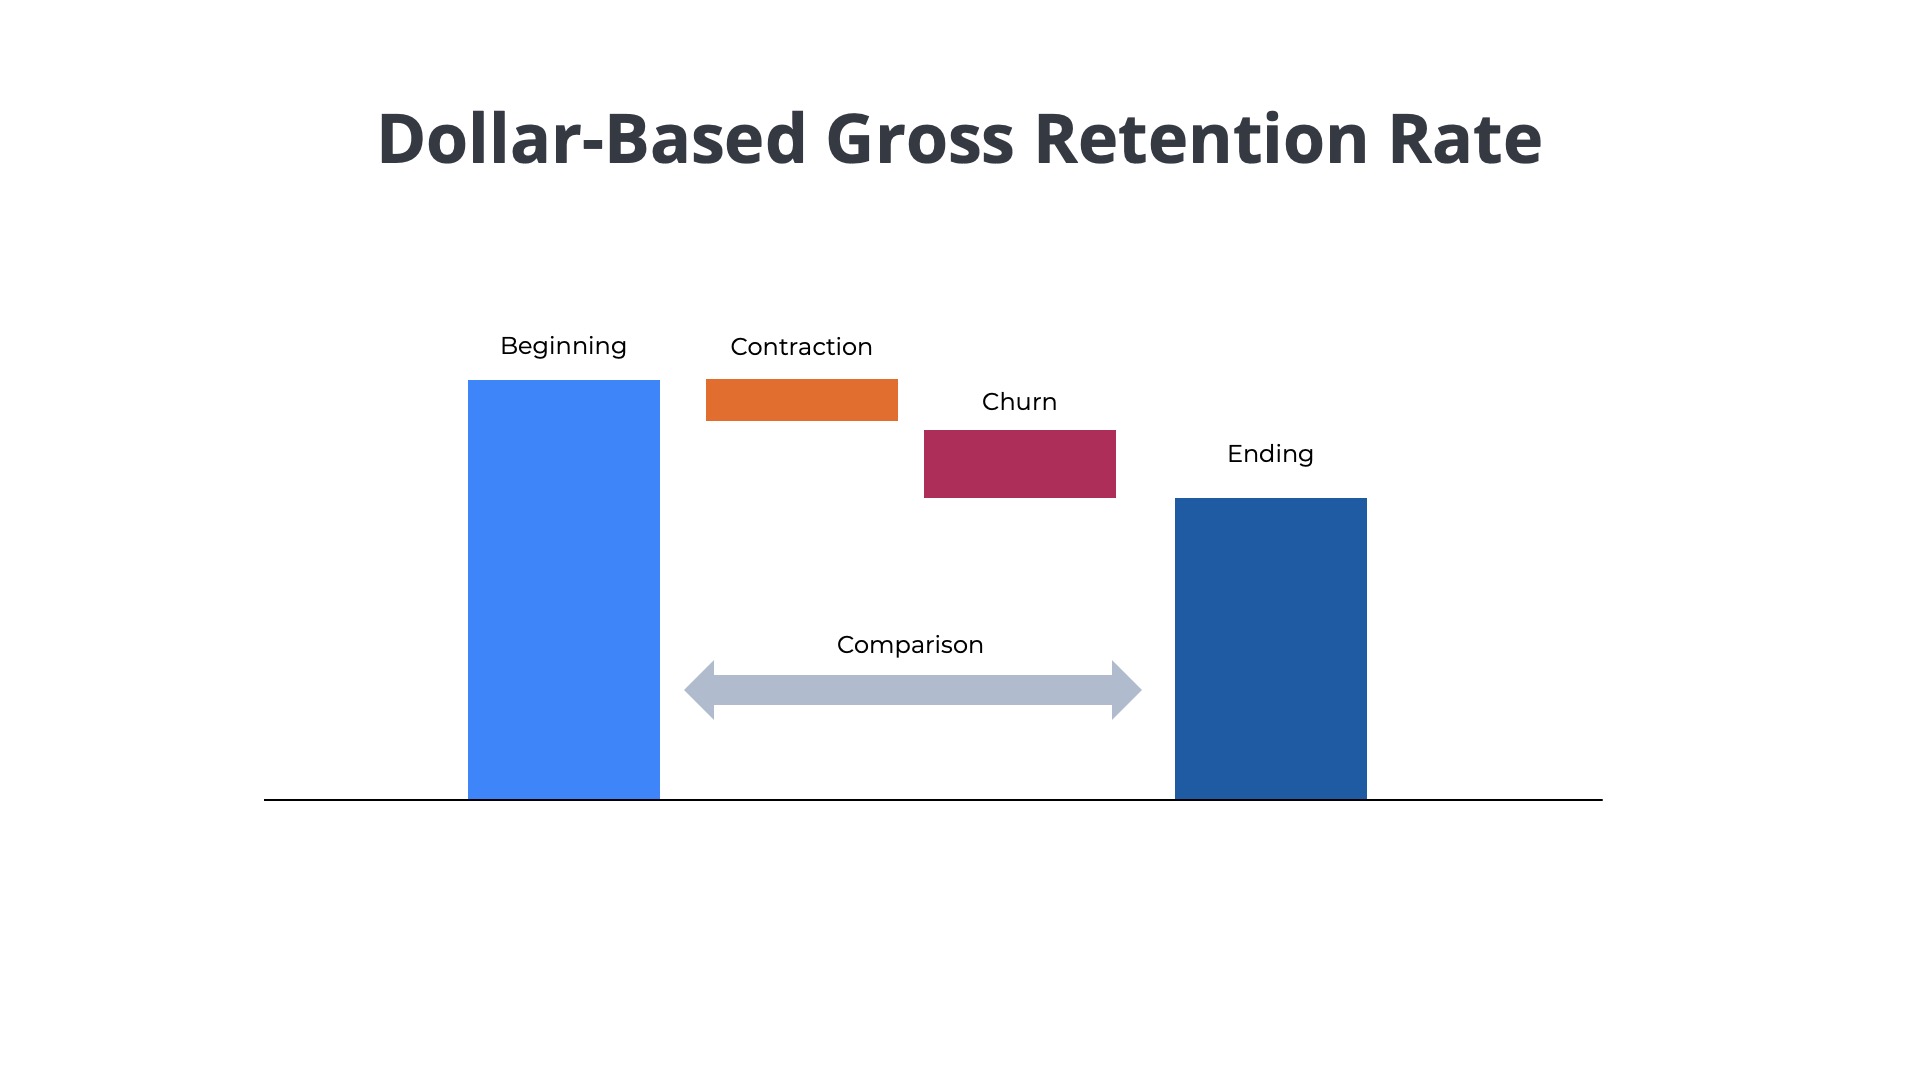
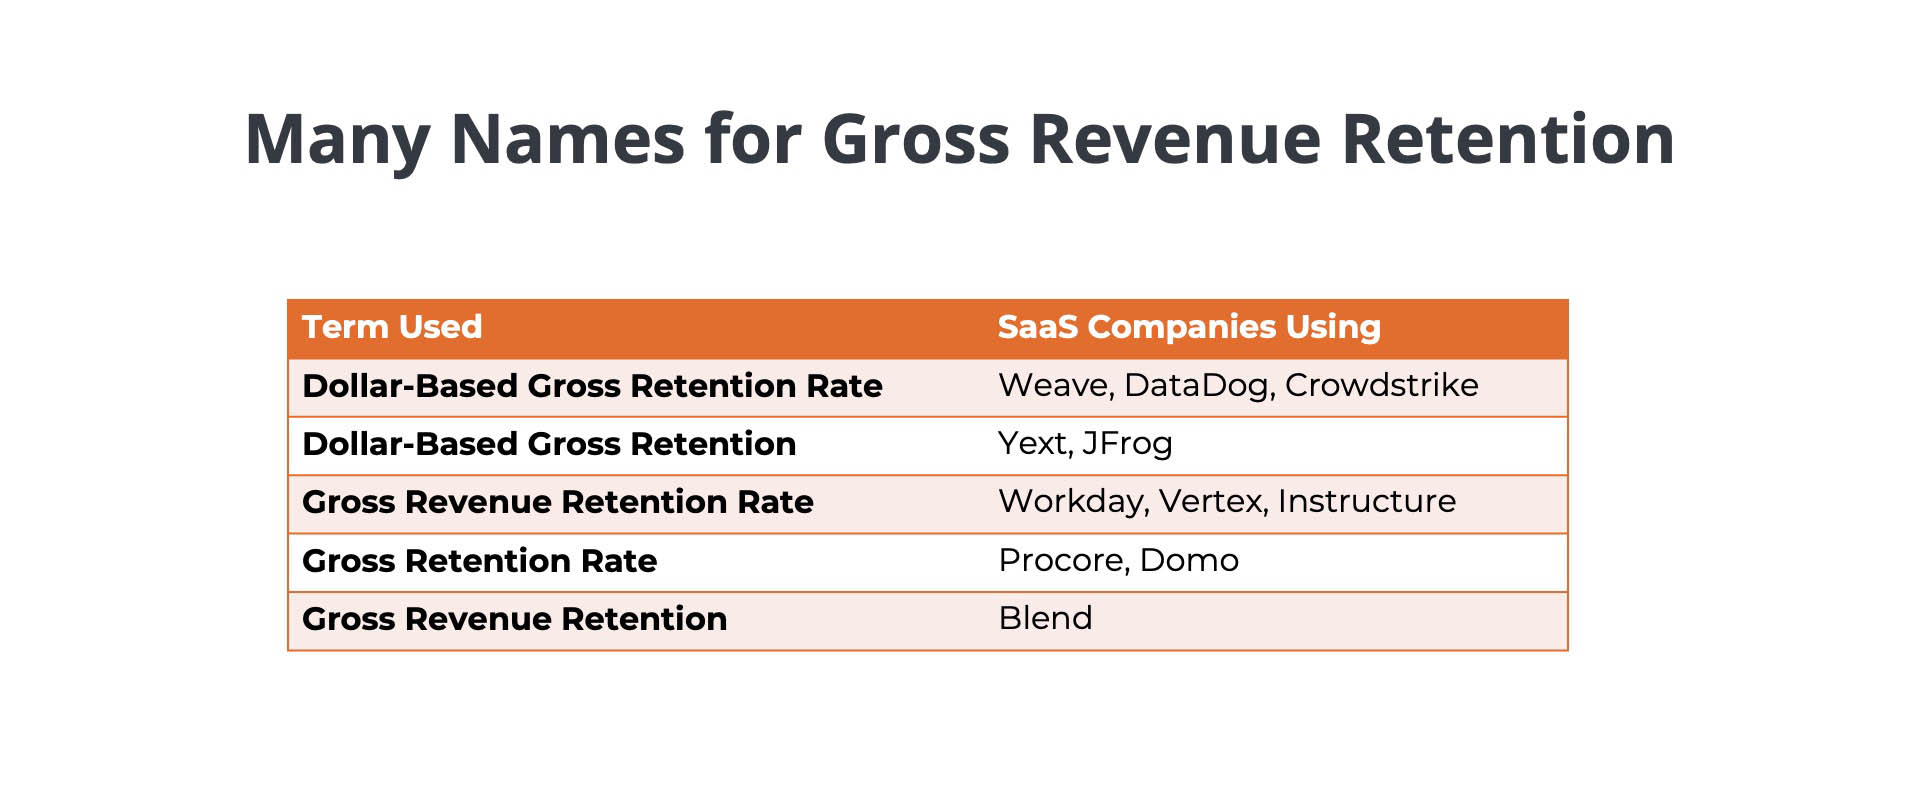
Understanding the Nuances: Dollar-Based Gross Retention, Gross Revenue Retention, and Gross Retention Rate
- Dollar-Based Gross Retention Rate
- Dollar-Based Gross Retention
- Gross Revenue Retention Rate
- Gross Retention Rate
- Gross Revenue Retention
These are all variations of the same metric. The use of different terminology does not necessarily indicate that the calculation is being performed in a different way. Some companies use the gross retention terminology incorrectly, reporting what is actually a renewal rate.
- What formula is being used (Base Revenue – Churn)/Base Revenue?
- What is the core metric (ARR, ACV, GAAP revenue)?
- What is the comparative period (consecutive years, corresponding quarters)?
- Is the reported number an average (trailing twelve months)?
- What is excluded from the calculation (e.g. small businesses, legacy products, monthly plans)?
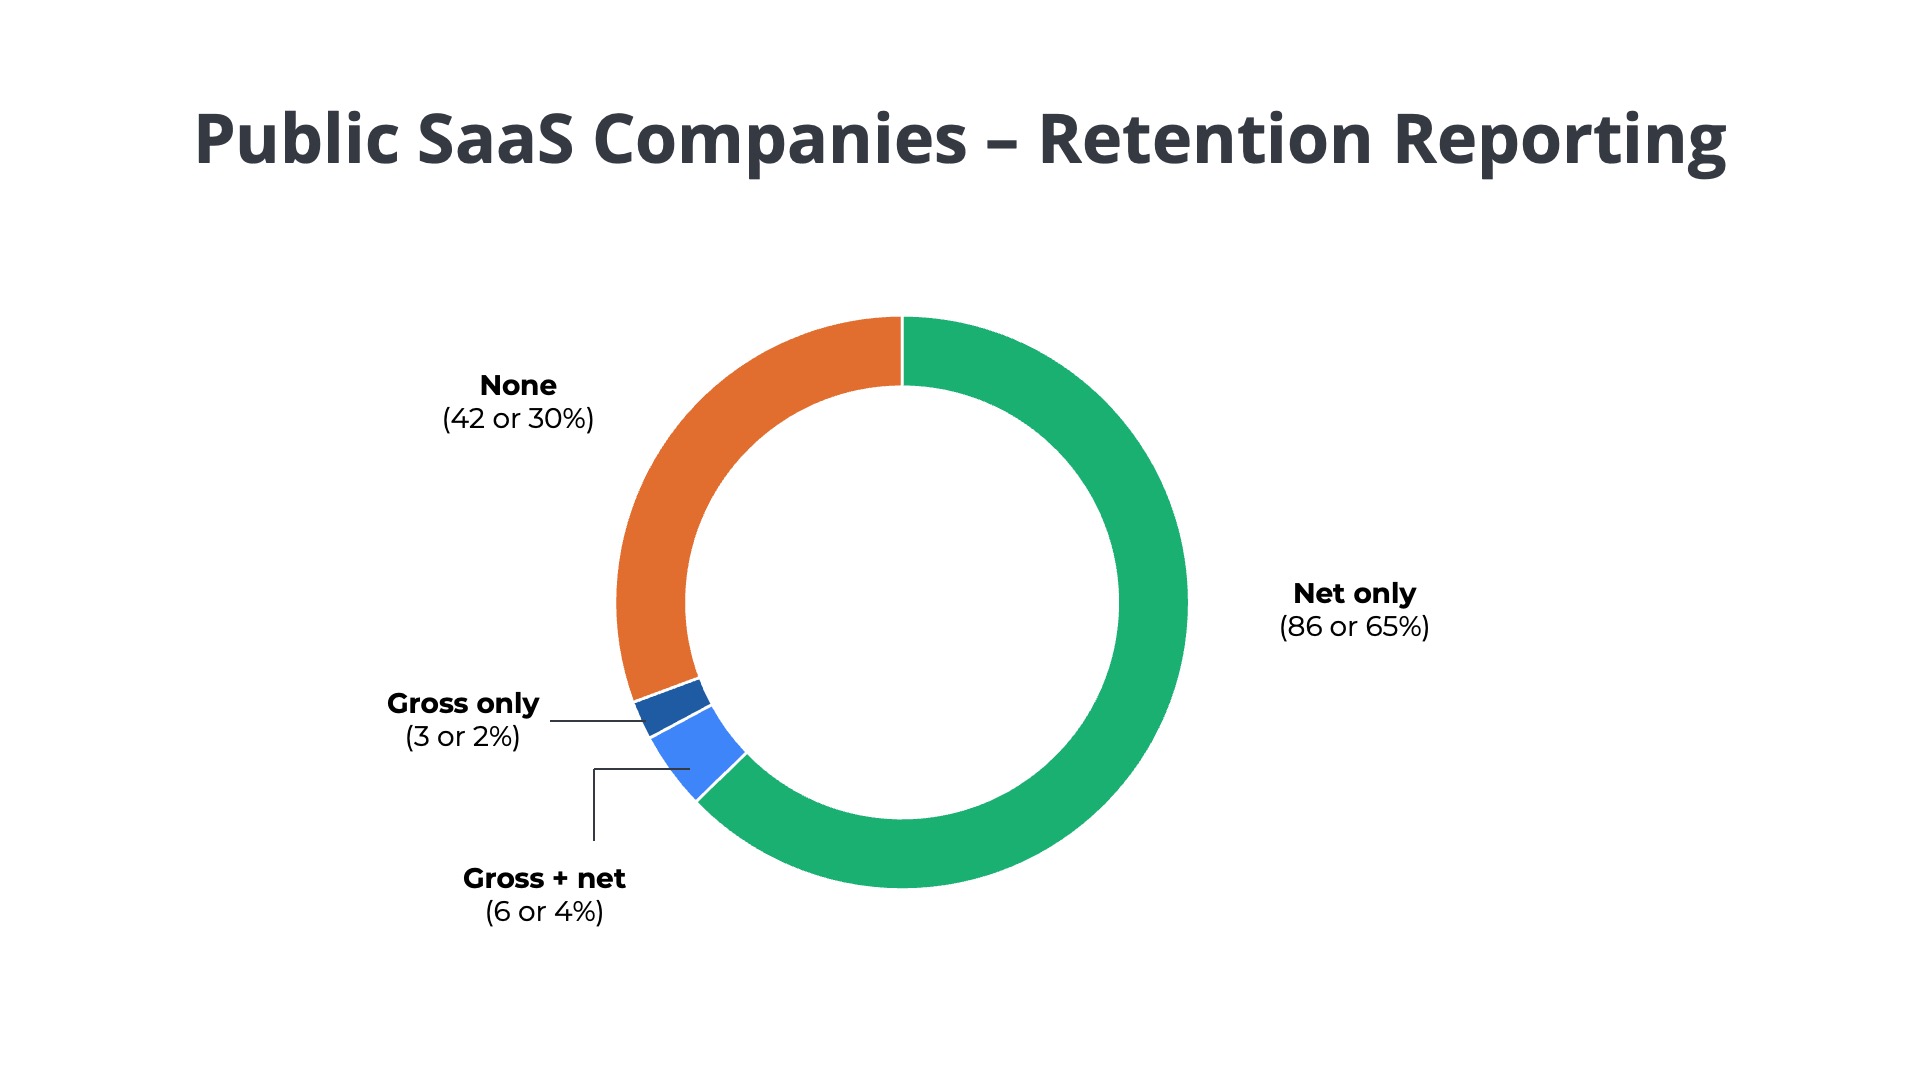
How Do Public SaaS Companies Disclose Their Revenue Retention Metrics?
There is no requirement for public SaaS companies to report on gross retention. An Ordway study of 140 companies found that only 9 disclosed their gross retention in SEC filings or investor relations as compared to over 70 that reported on net retention.
Final Thoughts on Enhancing Your Gross Revenue Retention
Ultimately, a robust Gross Revenue Retention rate is a powerful indicator of a SaaS company’s fundamental health and customer satisfaction. By meticulously tracking revenue lost only through churn and contractions, businesses gain critical insights into their core product value and customer loyalty. Maintaining a high GRR, ideally above 85%, demonstrates an ability to consistently deliver value and sustain a strong, reliable revenue base, which is indispensable for long-term growth and investor confidence.
Top Questions Answered About Gross Revenue Retention
What is Gross Revenue Retention (GRR) in SaaS?
GRR measures how much recurring revenue you retain from existing customers, excluding expansion. It accounts for downgrades and churn but not upsells.
How do you calculate GRR?
GRR = (Starting MRR − Churned MRR − Contraction MRR) ÷ Starting MRR. Calculate over a consistent period (monthly or annual).
What is a good GRR benchmark for SaaS?
Typically 85–95%+ depending on segment. SMB tends lower; mid-market/enterprise aim closer to 90–95%+ with strong product-market fit.
How can we improve GRR?
Strengthen onboarding, monitor leading indicators, improve support, address at-risk accounts, refine packaging/renewals, and reduce involuntary churn via dunning and smart retries.