
Summary
Understanding product attach rates is crucial for SaaS companies aiming to demonstrate sustained growth and customer value. This metric reveals how effectively a business expands its relationship with existing customers by selling additional products and services. Mastering the definition, calculation, and reporting of these rates provides invaluable insights into business health and investor appeal. Dive into how leading SaaS firms leverage product attach rates to drive revenue expansion and improve customer retention.
Key Takeaways
- Product attach rates are vital for SaaS companies to measure the success of their “land and expand” strategy, showcasing customer expansion over time.
- Reporting product attach rates can be customized, often focusing on the percentage of customers adopting multiple products, sometimes filtered by customer segments or product types.
- Higher product adoption typically correlates with increased Average Revenue Per User (ARPU) and reduced customer churn, indicating stronger customer loyalty.
- Leading SaaS companies like DataDog, Salesforce, and Hubspot utilize diverse reporting methods to highlight product attach rates, from trending views to contributions to revenue.
- Strategically presenting attach rates involves balancing the demonstration of robust upsell/cross-sell capabilities with communicating ongoing growth potential to investors.
Defining, Calculating, and Reporting Product Attach Rates
How SaaS Companies Define Product Attach Rates
Product attach rates measure how many customers have adopted 2, 3, 4, or 5 of a company’s offerings. Tracking adoption rates at a product level is one of the best ways to measure the effectiveness of the “land and expand” strategy. Strong attach rates demonstrate that a SaaS company can acquire new customers and expand its relationship with those customers over time by selling additional products and services. Investors track product attach rates along with other SaaS metrics like Net Revenue Retention (NRR), expansion ARR, customer cohort analysis, and churn to understand the health and performance of the business.
Investor Reporting on Product Attach Rates
Product attach rates can be reported in a number of different ways. In the most straightforward format, the count of customers adopting 2+, 3+, 4+, or 5+ products as of the end of the last quarter is presented. More commonly, however, SaaS companies don’t report on the count but instead the percentage of overall customers that have adopted 2+, 3+, 4+, or 5+ products. If attach rates are trending positively, investors will often be shown a trending chart with results for the past 4, 8, or 12 quarters. As with all SaaS metrics, finance organizations often make policy elections to include or exclude certain customers from the reporting. For example, some SaaS companies only present product adoption rates for specific customer segments, such as enterprise accounts. Others might present only customers with specific products, excluding offerings from recent acquisitions or products nearing end of life. Another interesting way to slice the data is to present adoption rates for new logos versus tenured accounts in the base. Displaying product attach rates can be tricky. On the one hand, SaaS companies want the adoption rates to be high to demonstrate their ability to upsell and cross-sell into the base. On the other hand, they also don’t want to give investors the impression that the base is saturated and has purchased all the company’s offerings. There needs to be a strong story around future growth potential.
Correlations between Attach Rates, Revenue, and Churn
Accounts that adopt more products should spend more and churn less. SaaS companies often show these types of correlations in investor presentations. For example, the average ARR of customers with 5, 6, or 7 products is compared to the contribution from accounts with 1, 2, or 3 SKUs. Similarly, the attrition rates for accounts with high adoption rates may be compared with those using one or two products. In this article, we’ll share examples of how eight different publicly traded SaaS companies report on product attach rates to their investors.
1) Customers with N number of Products
No SaaS company reports on the actual count of customers using 2, 3, 4, 5, or n products. Instead, they usually show the percentage of total accounts using 2, 3, 4, 5, or n products. For example, the report might show that 80% use 2+, 50% use 3+, and 25% use 4+. Some SaaS companies show how attach rates are trending over time, while others just show the results from the last quarter. The results are often filtered to exclude certain products (e.g., recent acquisitions or end-of-life) and specific customer segments (e.g., small businesses or international) from the reporting.
DataDog
For example, DataDog reports on how product attach rates trend over time. In a recent investor presentation (August 2024), they shared the slide below. It shows the percentage of customers using 2+, 4+, 6+, and 8+ products for the past ten quarters.
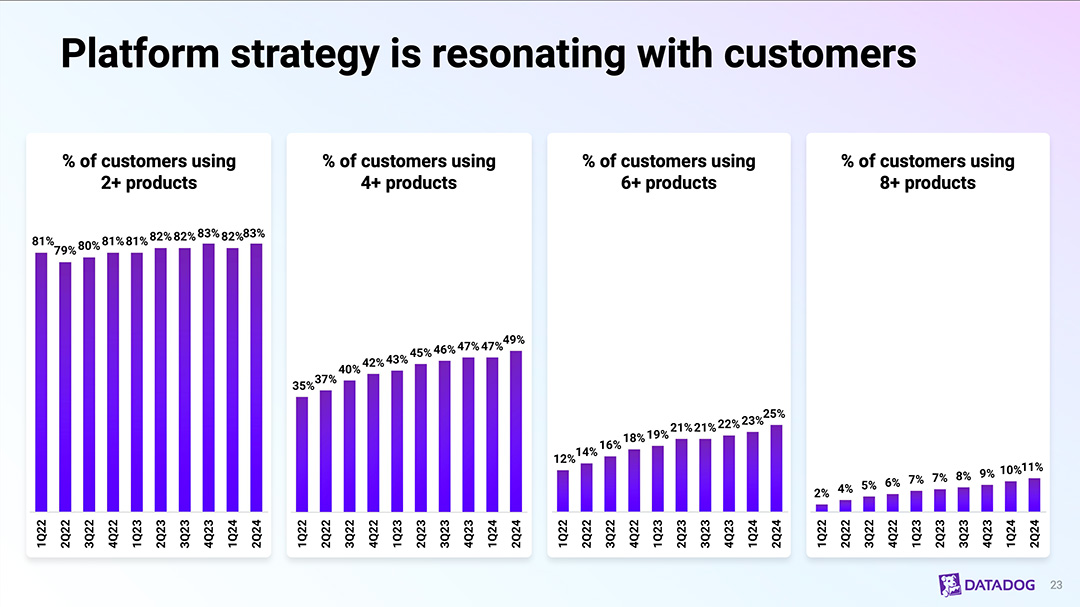
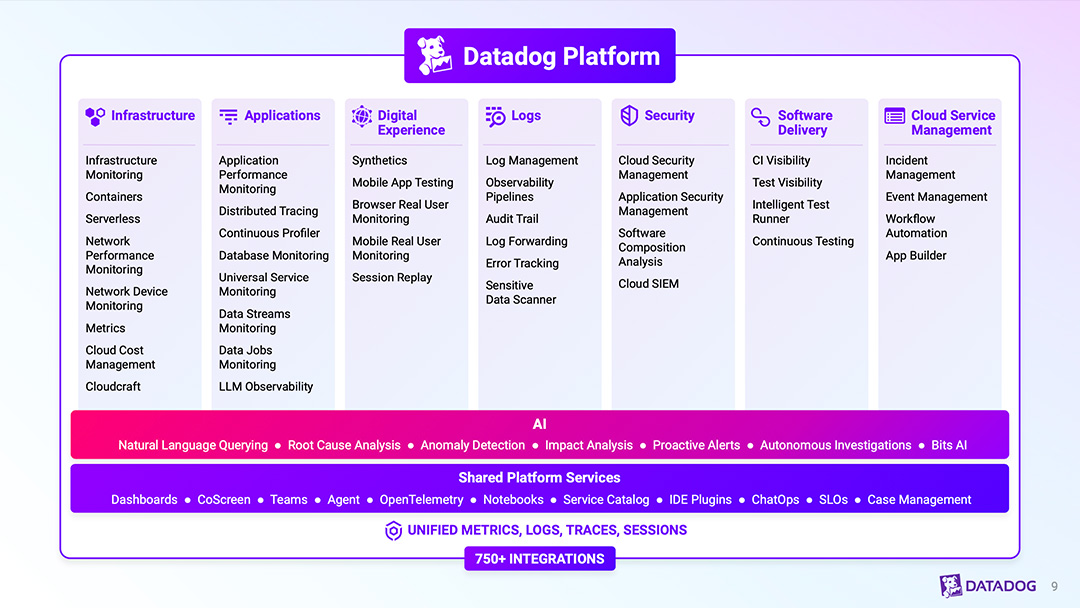
DataDog offers several dozen infrastructure and application performance monitoring services to track the health and performance of networks, databases, cloud, and application security. Generating expansion ARR through cross-selling and upselling into the base of almost 300,000 customers is one of DataDog’s key growth strategies. In a recent annual report, the company shared its strategy: “Expand within our existing customer base through broader deployments, new use cases and new product adoption. Our base of approximately 27,300 customers as of December 31, 2023 represents a significant opportunity for further sales expansion. We plan to continue to increase sales within our existing customer base through increased usage of our platform and the cross-selling of additional products.”
Crowdstrike
Sometimes SaaS companies will present a snapshot, point-in-time view of product attach rates rather than a quarterly trending report. For example, in a recent earnings call, the cybersecurity leader Crowdstrike showed the current adoption levels for the most recent quarter. Below is an example from a recent investor presentation (November 2023). Note, that on this particular view Crowdstrike does exclude one of its products from the adoption rate calculations, which is mentioned in the footnote at the bottom of the slide.
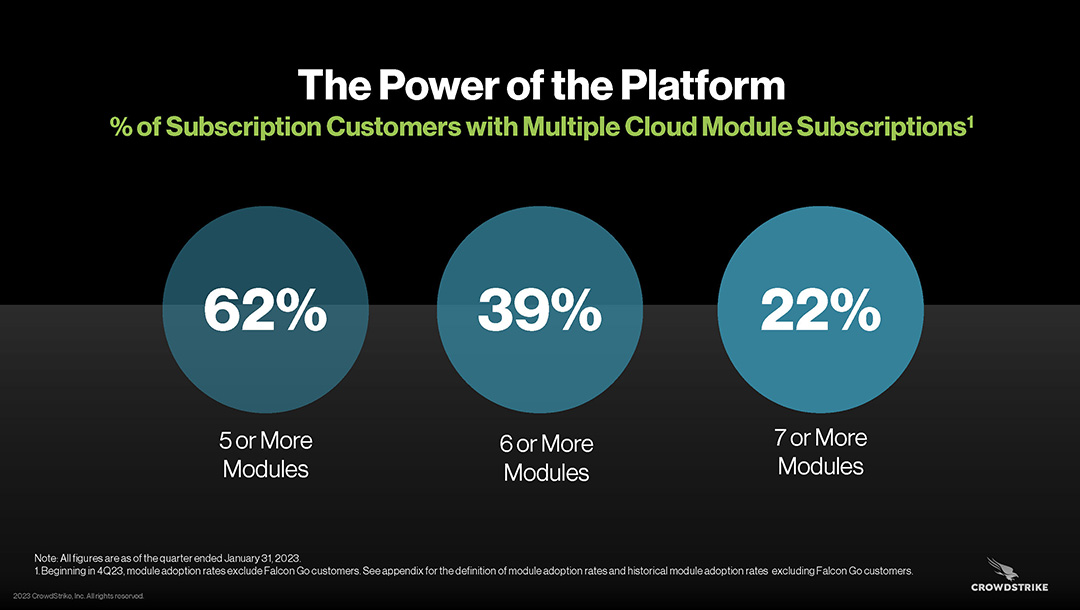
“Module adoption rates are calculated by taking the total number of customers with five or more, six or more, and seven or more modules, respectively, divided by the total number of subscription customers (excluding Falcon Go customers). Falcon Go customers are defined as customers who have subscribed with the FalconGo bundle, a package designed for organizations with 100 endpoints or less.”
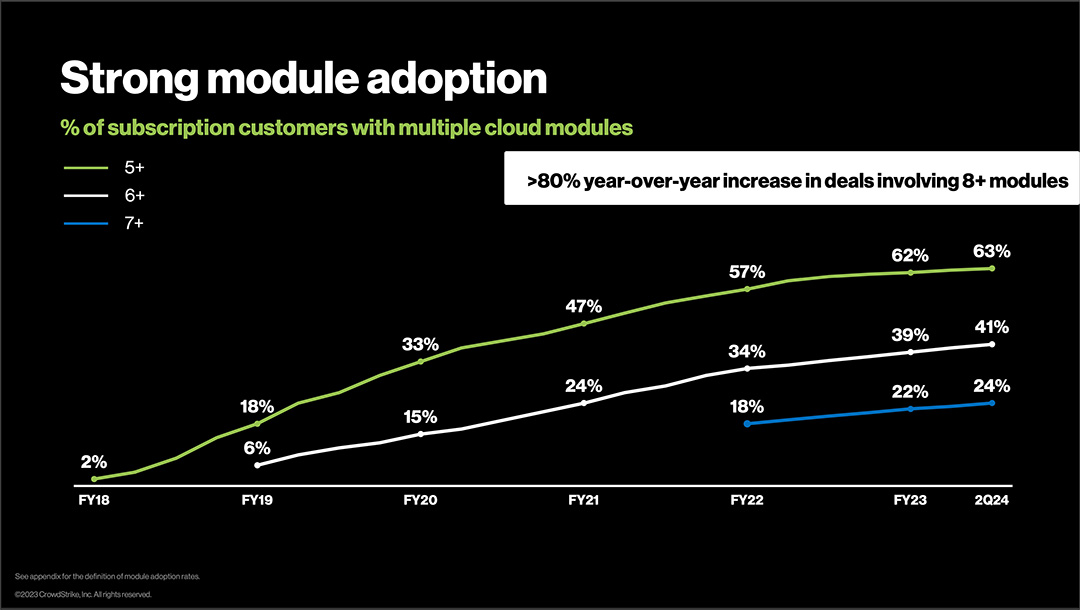
Crowdstrike also presents how adoption rates trend over time. Below is a slide from the company’s investor presentation at the 2023 Fal.con event.
2) Single-Product vs Multi-Product Customers
Some SaaS companies present more simplified product attach rate reports. Instead of showing the percentage of customers with 2, 3, 4, or 5+ products, they simply compare those with a single product to those with multiple products.
JFrog
JFrog offers a good example. The DevOps software provider has achieved very high levels of product adoption within its customer base. As shown in this investor presentation slide from 2022, 95% of its customers use multiple products.
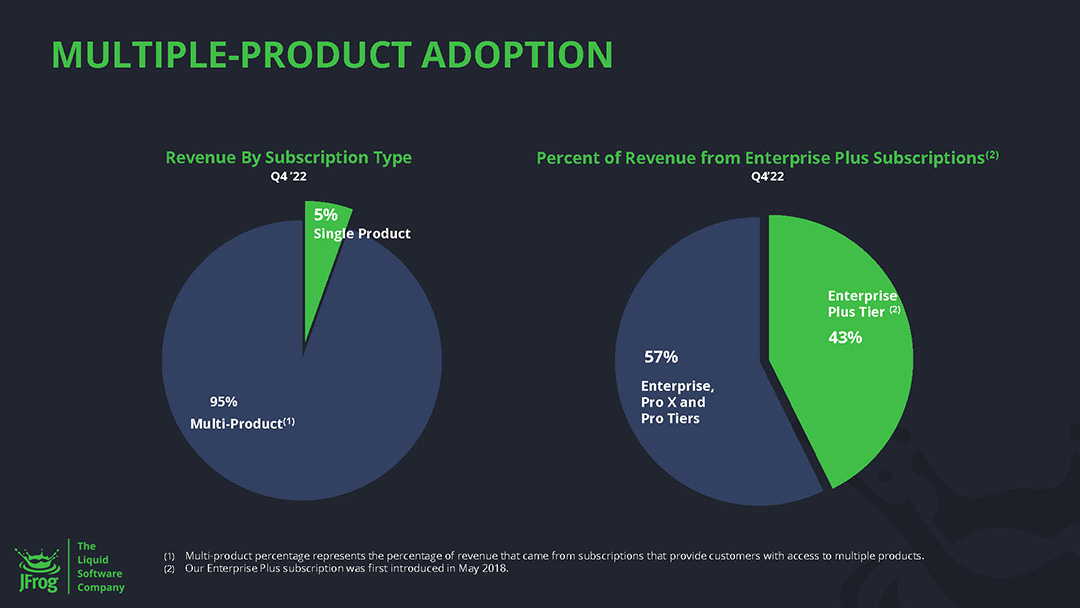
“We have demonstrated a differentiated ability to retain customers, expand existing customer usage, and cross-sell a broader set of products and features within an organization.” In its SEC fillings, JFrog lists expansion ARR from its existing customer base as one of its key growth drivers: “Our customer success teams are focused on enabling organizations to realize the full benefits of our platform by helping them advance DevSecOps practices and promoting the adoption of additional products and more advanced functionality of our platform. We intend to continue to expand our strategic sales team to identify new use cases and drive expansion and standardization on JFrog within our largest customers.”
3) Product Attach Rates for New Customer Acquisition
Most SaaS companies think about product attach rates in the context of a land and expand motion to grow revenue from the installed base of accounts. However, some also focus on high attach rates for new accounts. The earlier you can get customers to adopt multiple products the higher lifetime value you are likely to achieve from the account. Furthermore, higher adoption rates should result in lower attrition as they imply the customer is making a longer-term commitment to buying a platform (or suite) rather than a point solution that can be easily replaced.
Hubspot
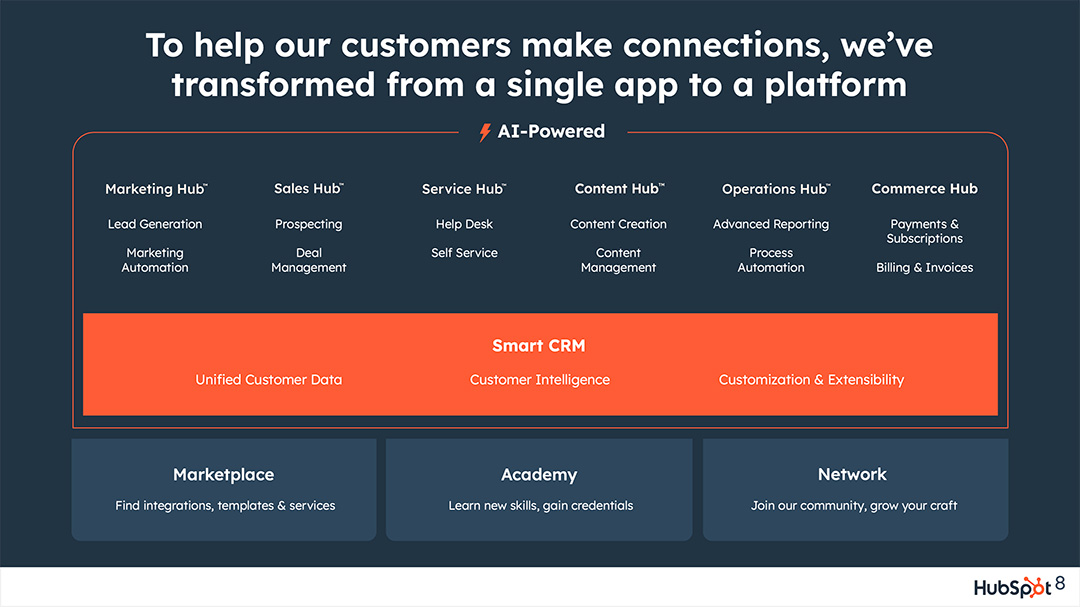
Hubspot is a good example of a SaaS company that is focused on achieving high adoption rates in new logo acquisition. Hubspot sells a number of different hubs, each aligned with automating a different part of the customer relationship. The company offers hubs for marketing, sales, service, operations, commerce, and CMS.
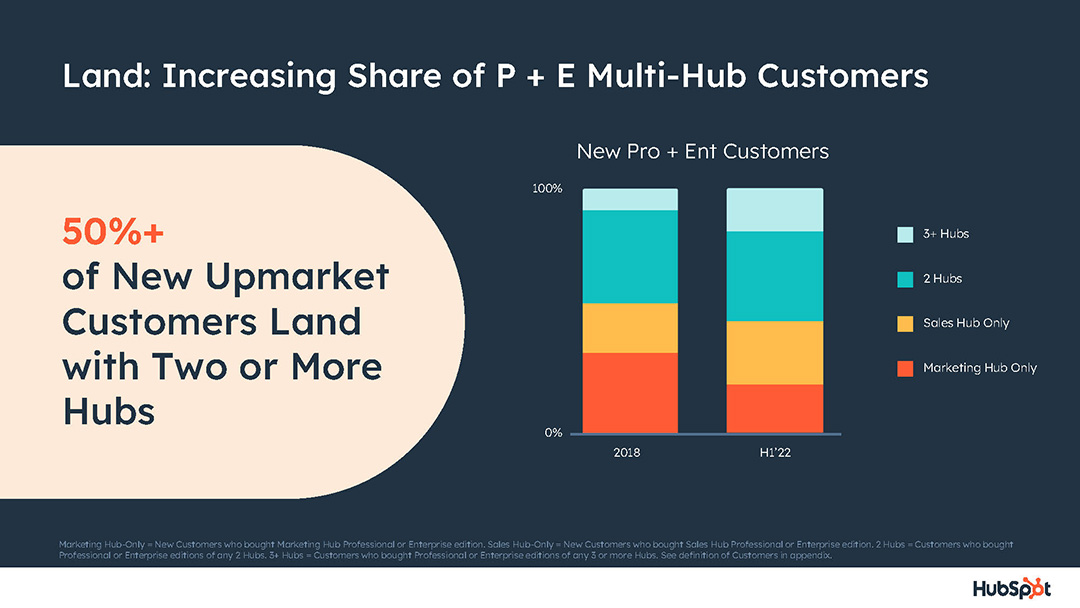
In the company’s 2022 analyst day presentation, Hubspot shared the chart below. It shows product attach rates for new customer acquisition. Specifically, the graph illustrates how the percentage of new customers purchasing two or three hubs has grown between 2018 and 2022.
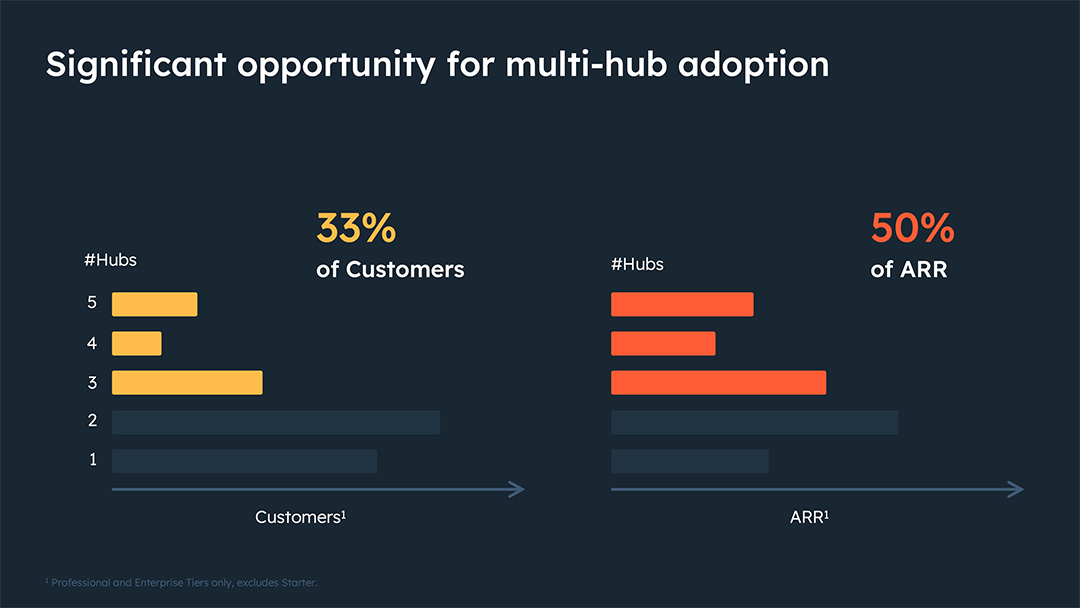
Hubspot is also focused on expanding its share over wallet over time by cross-selling new product hubs into its installed base of accounts. Below is a chart from Hubspot’s 2023 analyst day presentation that shows how many total customers (versus just new logos) have adopted each of its hubs.
The company outlines its overall customer growth strategy in a recent annual report: “Increase Revenue from Existing Customers. With 205,091 Customers in more than 135 countries spanning many industries, we believe we have a significant opportunity to increase revenue from our existing customers. We plan to increase revenue from our existing customers by expanding their use of our customer platform by upselling additional offerings and features, including our end-to-end payment solution, adding additional users, and cross-selling our marketing, sales, service, operations, commerce, and content management products to existing customers through touchless or low touch in-product purchases. Our scalable pricing model allows us to capture more spend as our customers grow, increase the number of their customers and prospects managed on our customer platform, and offer additional functionality available from our higher price tiers and add-ons, providing us with a substantial opportunity to increase the lifetime value of our customer relationships.”
4) Ranking of Products with Highest Adoption Rates
Another popular way to present product attachment rates is to show adoption rates by SKU. Each product is ranked by the percentage of customers (or number of customers) who have purchased it. Using the specific product names provides investors with some additional color on which specific SKUs have the highest sales.
Workday
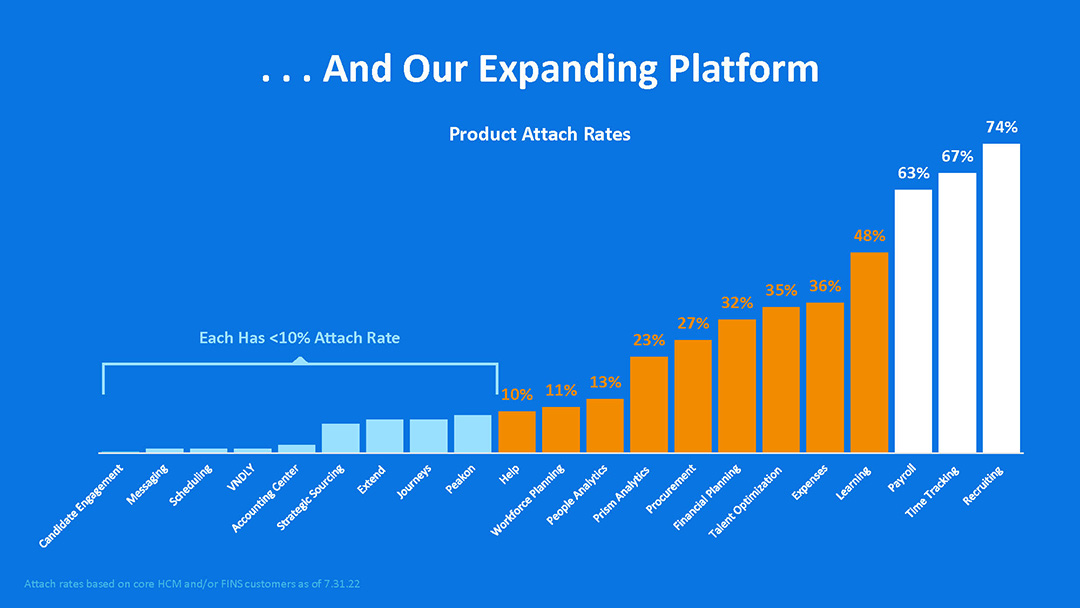
For example, Workday grouped its offerings into three different categories based on level of adoption. See the slides below from the company’s 2022 analyst day presentation. Recruiting, payroll, and time tracking (displayed in white) each have over 60% adoption rates. A second category of nine additional products, including expense reporting, procurement, and e-learning, have between 10-50% adoption. A third category of newer offerings have a less than 10% adoption rate. This type of grouping shows that the company has been effective at penetrating its base of accounts with multiple SKUs, but also that there remains considerable opportunity to upsell even more value into the installed base of accounts.
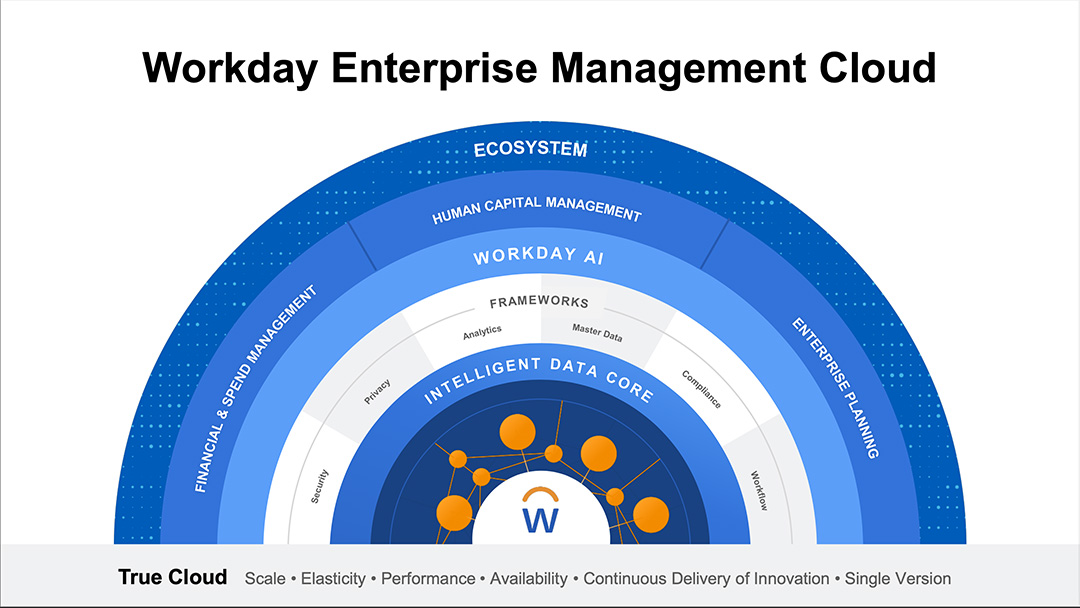
Workday offers dozens of different products to support its customers’ back office operations. They group the products into five suites: financial management, spend management, human capital management, planning, analytics, and benchmarking. One of Workday’s key growth strategies is capturing a greater share of wallet from existing customers through expansion deals.
An excerpt from the company’s recent SEC 10-K filing explains: “Our sales strategy is focused on both adding new customers and on growing our relationships with our existing customers to expand the adoption of our suite of solutions over time. As our customers realize the benefits of our entire suite of service offerings, we aim to upgrade the customers’ experience with new products and features, and gain additional subscriptions by targeting new functional areas and business units. Additionally, by extending our go-to-market capabilities globally, we aim to grow our business by selling to new customers in new regions.”
5) High Attach Rate Customers’ Contribution to Revenue
Another way to present attach rates is to illustrate how contribution to revenue correlates with product adoption levels. As you might expect, customers using more products contribute more revenue to the business.
Salesforce.com
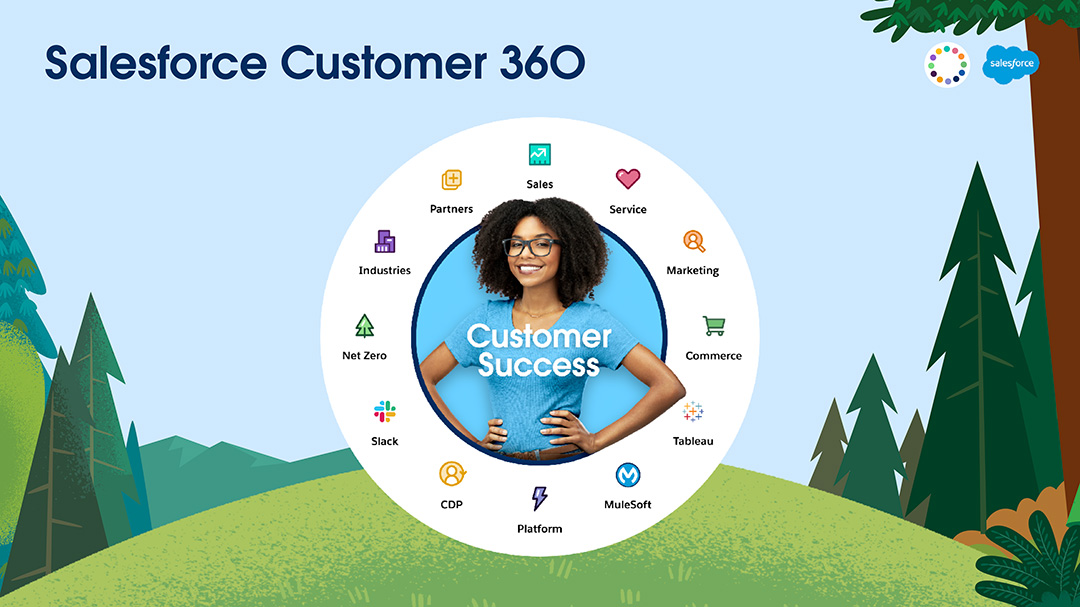
Salesforce.com is one of the largest and most mature SaaS companies with a broad suite of products. Salesforce groups its products into different clouds centered around its Customer 360 platform. “Our industry-leading Customer 360 CRM platform spans sales, service, marketing, commerce, collaboration, integration, AI, analytics, automation, industries and more.”
A key element of Salesforce’s growth strategy is cross-selling more clouds into larger accounts. The company explains the strategy in a recent annual report: “Expand relationships with existing customers. We see significant opportunities to deepen existing customer relationships through cross-selling and upselling our service offerings. For example, we continue to focus on driving multiple service offering adoption, which provides our customers with a one-stop shop for their front-office business technology needs. As our customers realize the benefits of our entire suite of service offerings, we aim to upgrade the customers’ experience with new products and features and gain additional subscriptions by targeting new functional areas and business units. Finally, we aim to expand our relationships with existing customers through our additional support offerings.” Salesforce tracks the average ARR and attrition rates for customers with high attach rates. As you can see from the slide shared in the company’s 2022 analyst day presentation, there is a dramatic increase in ARR for customers that use 5, 6, or 7 clouds. There is also a significant drop off in customer attrition for high attach rate accounts.
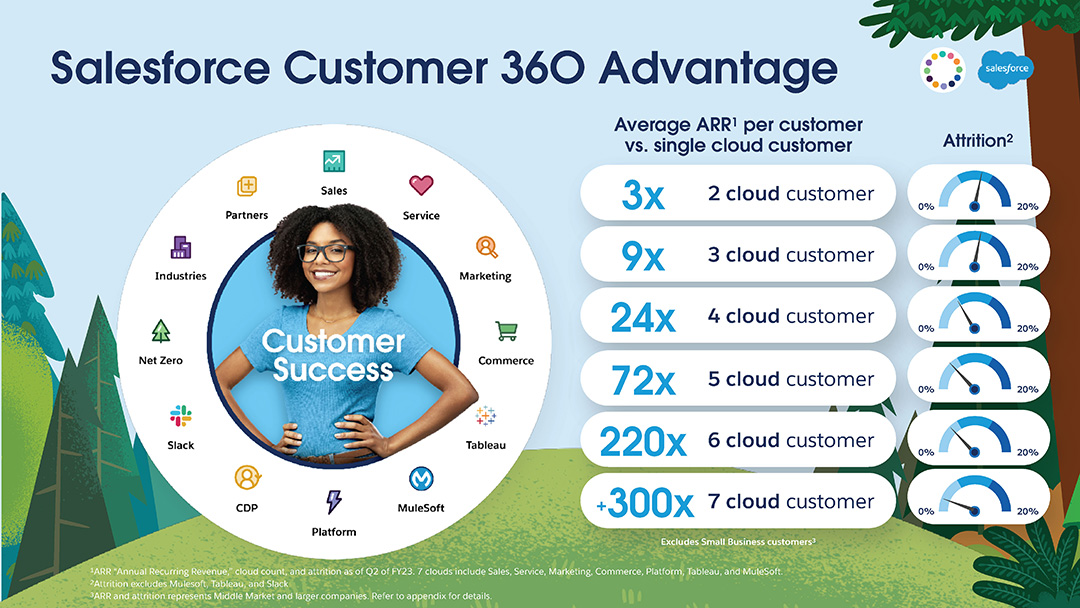
Note, that Salesforce has filtered the products and customer segments included in the attach rate reporting. The footnotes at the bottom of the slide indicate that recently acquired products from Mulesoft and Tableau are not included in the attrition reporting. However, they are included in the ARR figures. Also, note that small businesses are excluded from the charts: “ARR and attribution represents Middle Market and larger companies.”
6) Attach Rates for Specific Combinations of Popular Products
For some SaaS companies, specific product combinations lead to magical results. Two or more specific SKUs might have compounding benefits that result in higher revenues and lower attrition rates. As a result, the companies might track product attachment rates for the specific SKU combinations—n% of companies that use product A also use product B.
Billtrust
Billtrust offers an interesting example of tracking specific combinations of product attach rates. Billtrust is a leader in the order-to-cash software space. Billtrust was taken private a few years back, but their most recent SEC filings as a public company explain their product suite: “<Billtrust> Our solution is at the forefront of the ongoing digital transformation of accounts receivable (“AR”), providing mission-critical solutions that span credit decisions and monitoring, online ordering, invoicing, cash application, and collections. Our Business Payments Network (“BPN”) connects B2B buyers and sellers to a community of banks, FinTechs, and card brands. Billtrust automates payments from digital lockbox to final posting in ERP, bridging receivables with buyers’ payment processes so sellers can manage cash flow more strategically and make it easier for customers to do business with them.”
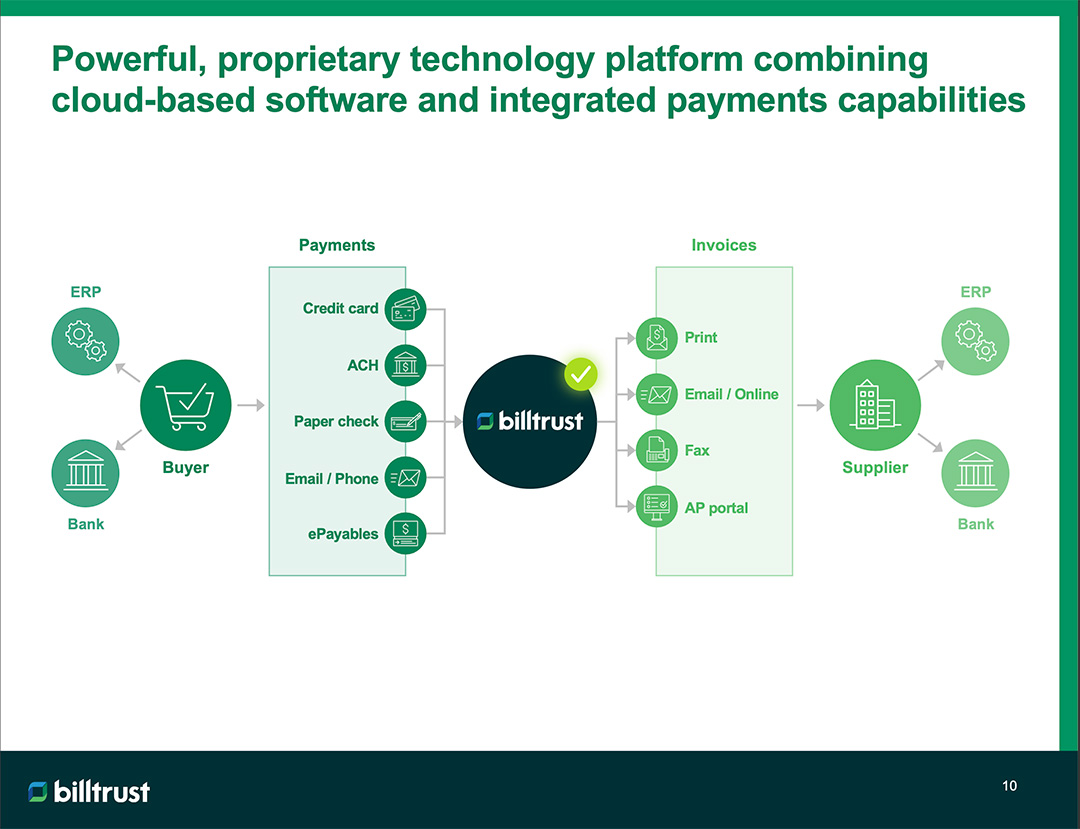
“Our secure, proprietary platform offers customers multiple ways to present invoices (online, email, AP portal, and print/mail) and receive payments (credit card, automated clearing house (“ACH”), email, phone and paper check). Our electronic solutions (“eSolutions”) team works closely with our customers to transition their users from paper invoices and payments to electronic, which results in accelerated savings, faster realization of cash, a reduced environmental footprint, and a better user experience.”
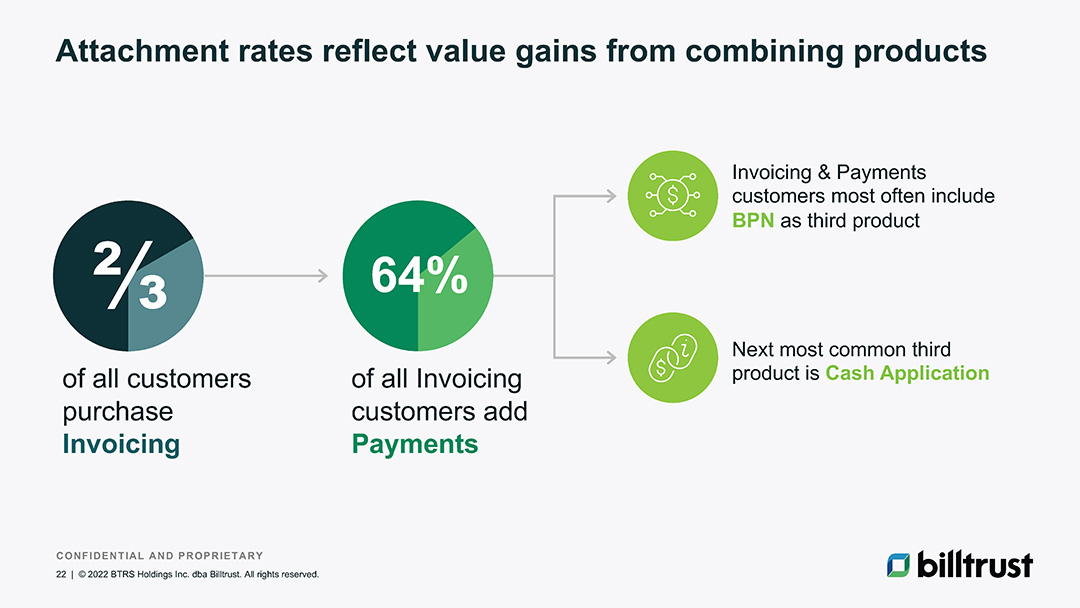
In the chart above, Billtrust explains how customers who purchase invoicing also frequently adopt the payments service, Billtrust Payment Network, and cash application.
Conclusion
Mastering product attach rates is fundamental for any SaaS company committed to sustainable growth and demonstrating deep customer engagement. By strategically defining, calculating, and reporting these rates, businesses can clearly showcase their ability to expand customer relationships, drive significant revenue increases, and build long-term loyalty. This focus not only strengthens investor confidence but also provides a clear roadmap for future product development and customer success initiatives.
Frequently asked questions
What is product attach rate in SaaS?
The percentage of customers who purchase one or more add‑on products/features alongside the core subscription.
How do you calculate attach rate?
Attach Rate = Customers with add‑on ÷ Total customers of the core product, or measured by revenue: Add‑on ARR ÷ Core ARR.
What is a good attach rate benchmark?
Varies by category and price; 20–40%+ for widely useful add‑ons is common. Mission‑critical, low‑friction add‑ons can exceed 50%.
Which tactics increase attach rates?
Clear value props, bundled “good/better/best” tiers, in‑product prompts, time‑boxed trials, targeted offers at activation or renewal, and CSM‑led QBRs.
How should teams report attach rates?
Track by segment, plan, and cohort; monitor attach ARR, ARPA lift, and churn impact. Instrument in analytics and review monthly with GTM.
You May Also Like
 Netskope’s SaaS Metrics at IPO
Netskope’s SaaS Metrics at IPO
 What is the Rule of 40 in SaaS?
What is the Rule of 40 in SaaS?
 SaaS Churn Rate Calculation Examples