Billable Usage Quantity
High Water Mark, Percentile Billing, and Usage Pooling
High Water Mark, Percentile Billing, and Usage Pooling
With usage-based pricing models the “billable usage quantity” may or may not be the same as the actual amount of consumption that occurs. The customer may have used 500 hours of a service, but is actually only invoiced for a billable usage quantity of 350 hours.
SaaS and cloud providers have a variety of creative methodologies such as used to calculate billable usage quantity. Some methodologies are customer-friendly such as percentile billing, designed to ensure that the account is not being over-charged for spikes in usage or anomalies that are not representative of their true consumption. In other cases such as high water mark billing, the calculations are designed to maximize the amount of revenue that the SaaS or cloud provider generates.
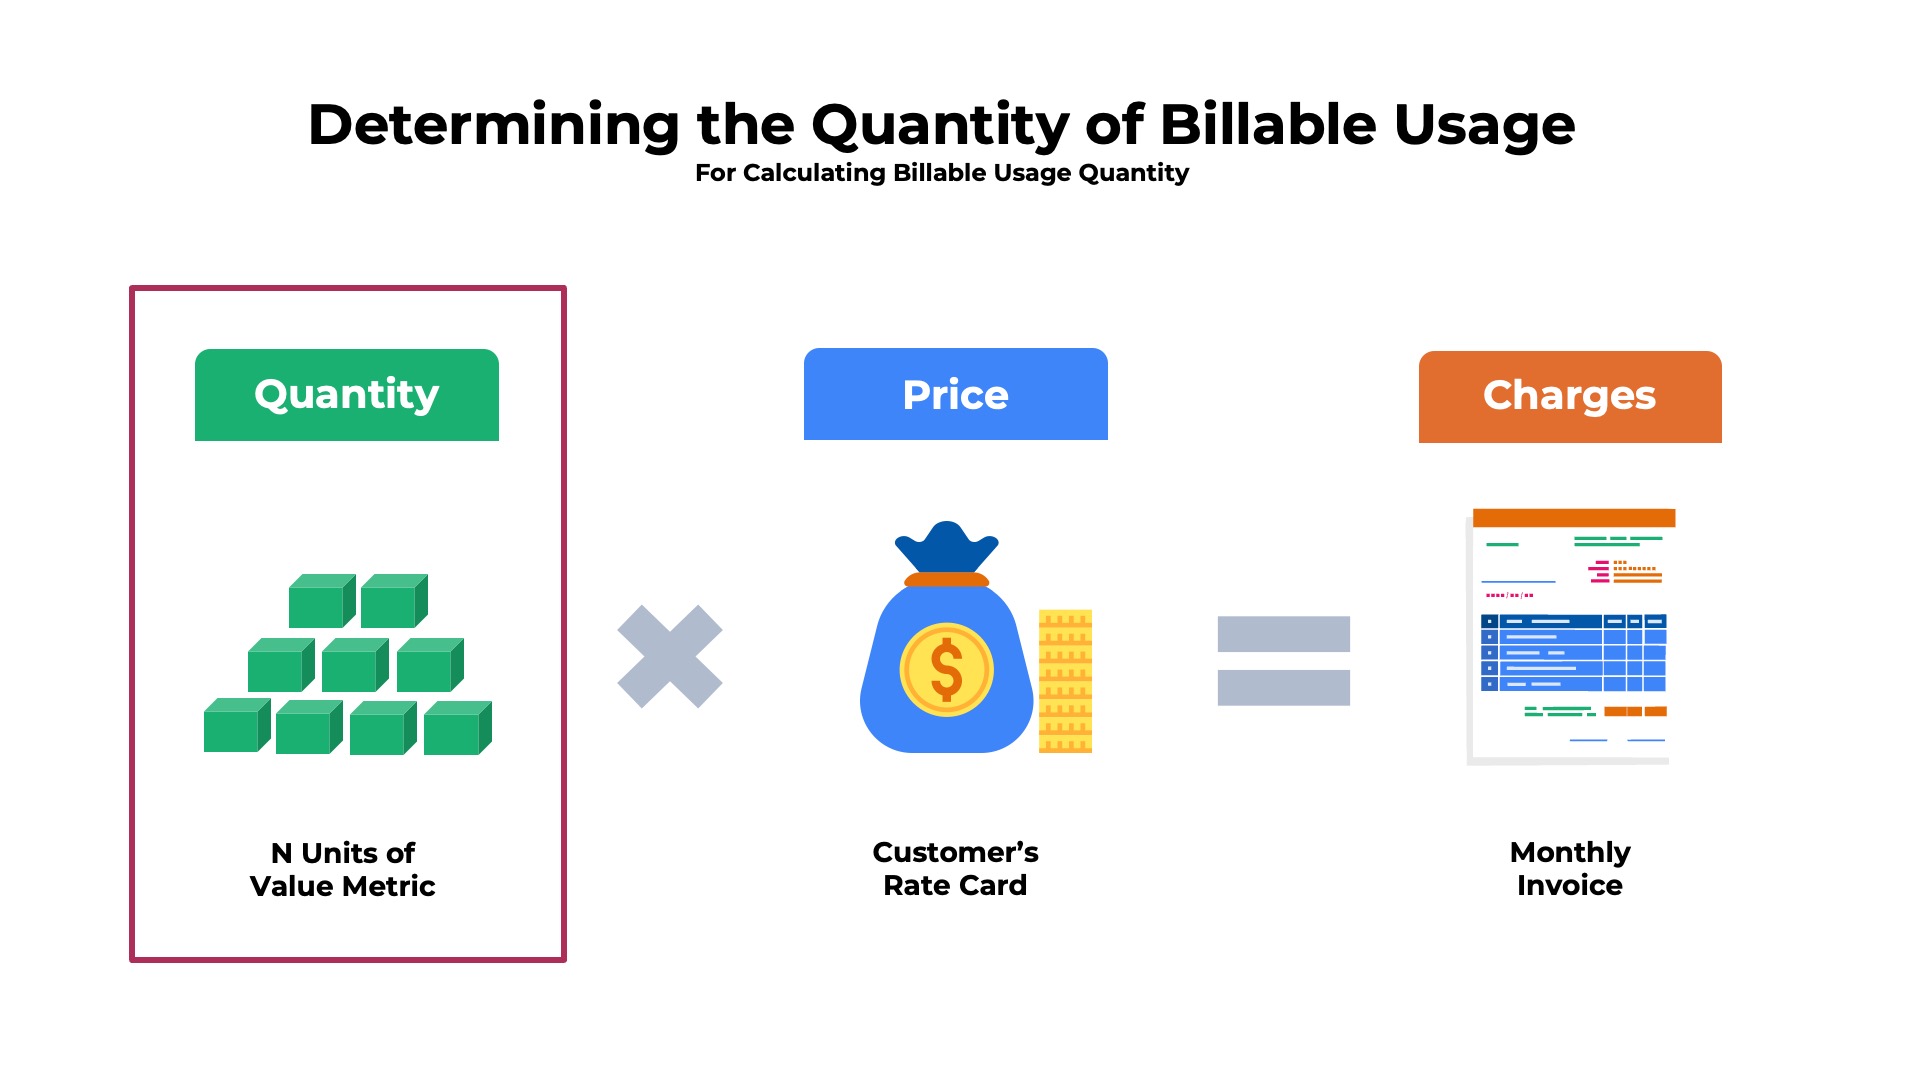
The process to calculate billable usage quantity is relatively straightforward in some cases. In the simplest model billing records are sorted by each individual customer then counted up to arrive at the number of units (i.e. the summary count model). In other cases, the process can be significantly more complex such as with percentile billing or high water mark billing. Several mathematical operations may need to be performed to arrive at the right quantity.
Typically, a certain level of pre-processing is required on the usage data before the billable usage quantity can be calculated. Three common examples of pre-processing include:
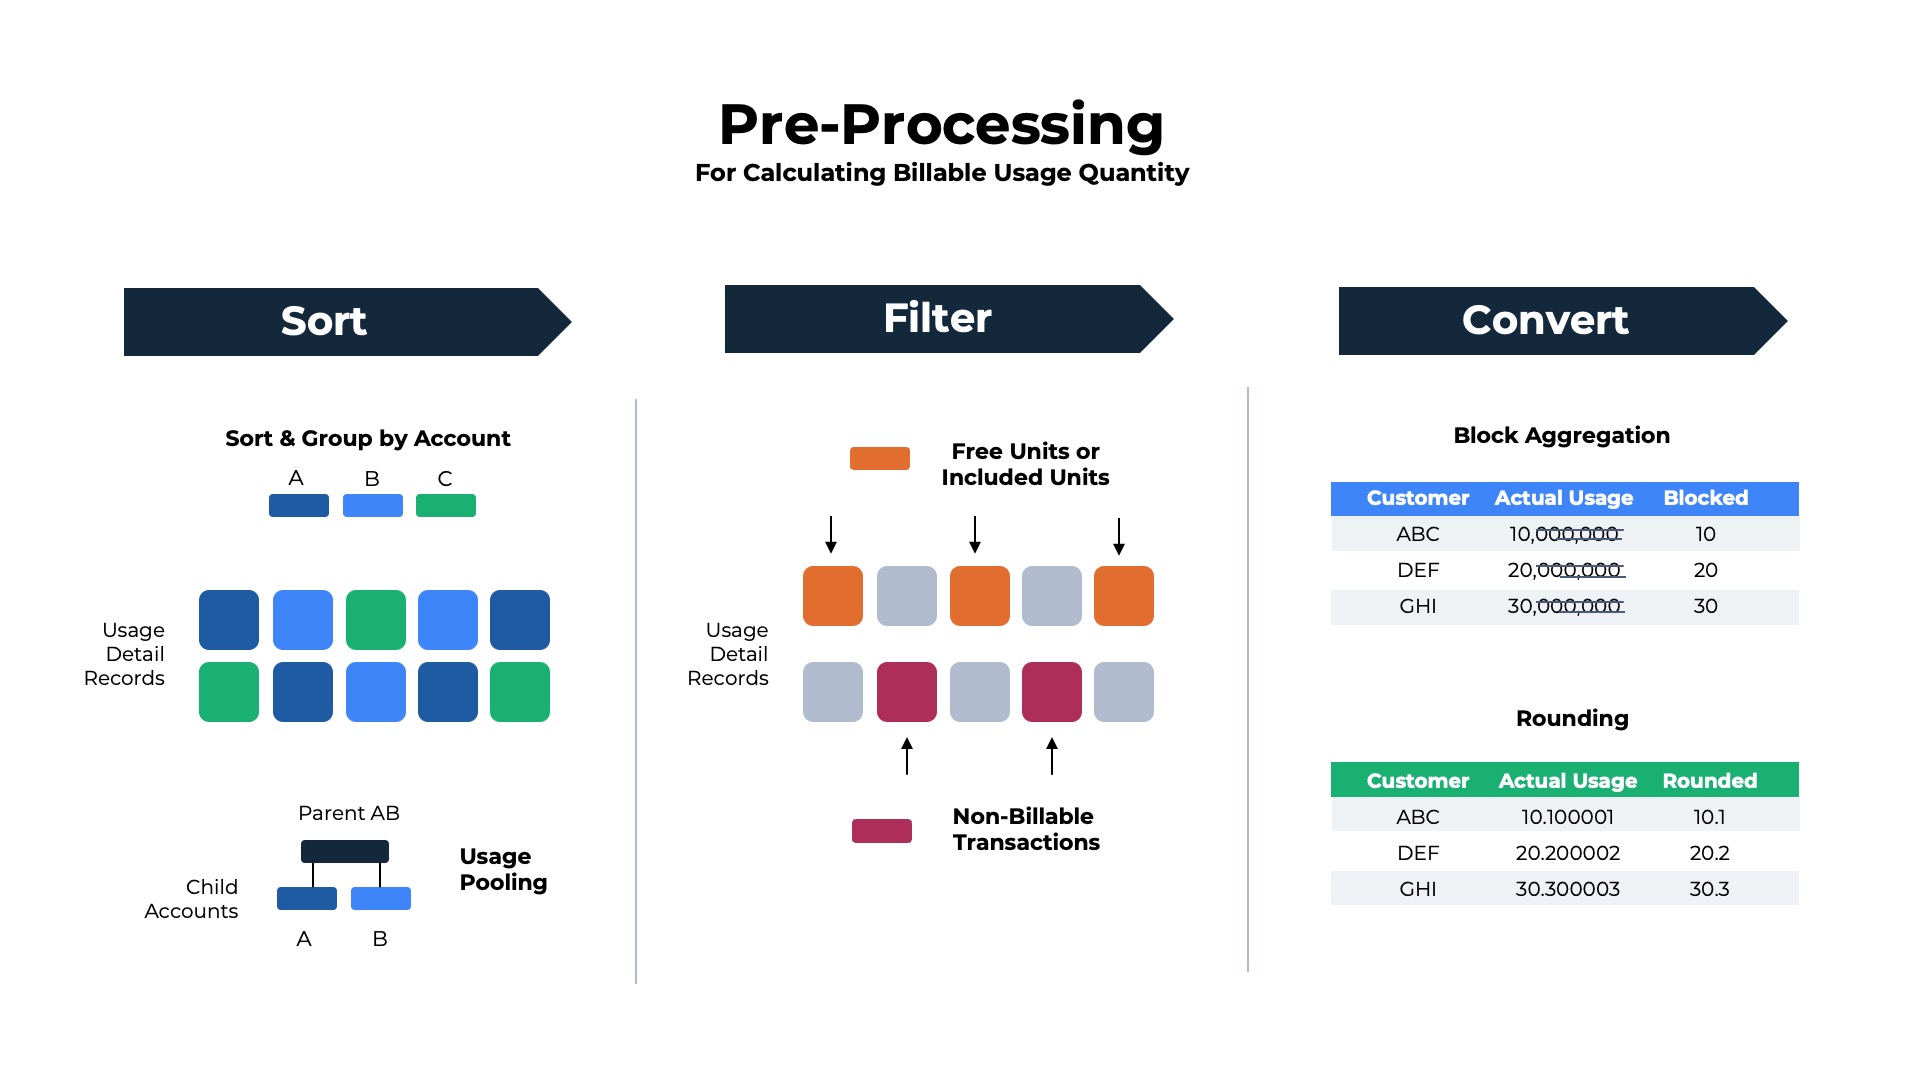
The raw consumption data that is posted through the SaaS or cloud product’s metering function is often a long list of individual event records that occurred during the billing period. It is not uncommon for the detailed usage records to number millions if not billions of rows per month. The raw data will need to be sorted by customer account and product before any quantity calculations can be performed.
The raw data will need to be sorted by customer account and product before any quantity calculations can be performed.
Large enterprises with multiple business units often require specialized reporting and billing arrangements that complicate the quantity calculations. Typically, each independent business unit will want to have their own organization’s consumption tracked and reported on separately. However, the separate business units also want to benefit from the aggregate purchasing power of the whole company to maximize discounts.
As a result, the combined usage of all the business units will be pooled together to perform the billing calculations, but then split apart for presentation on the invoice and reporting.
Many cloud providers price units in blocks of hundreds, millions, or thousands. In these instances total amount of usage will need to be divided by the block quantity to arrive at the billing metric.
For example, suppose an observability platform might be priced at $0.01 per 10K test sessions. In the latest month, Customer A has 800,000,000 test sessions. The billable quantity for Customer A would be 800,000,000 divided by 10,000 or 80,000 units.
Below is an example of a cloud observability and management platform that bills based upon blocks rather than units of one. The block size varies for different services and units of measure – events, monitored runs, and monitored resources.
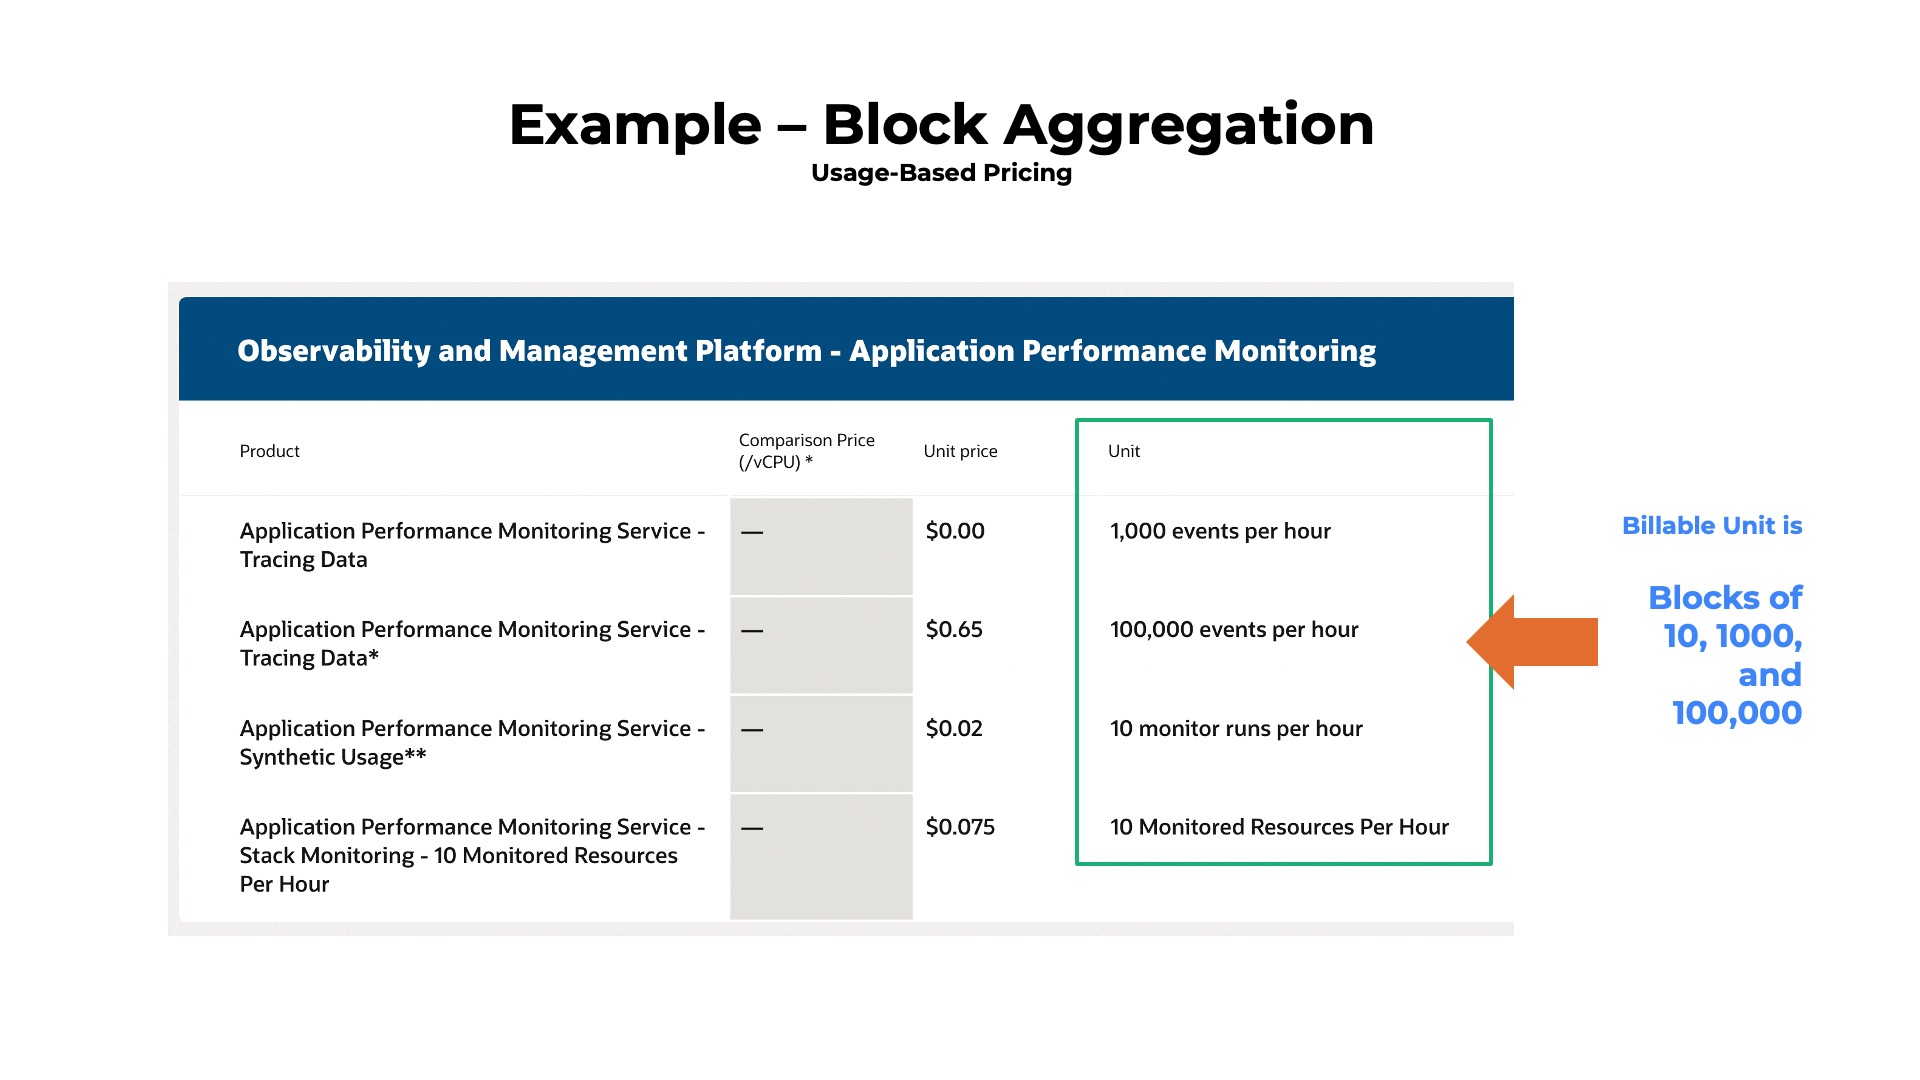
For additional information on the specific example of block aggregation pricing shown above visit the Oracle Cloud pricing page.
Often usage data is captured with more precision (decimal places) than is needed for billing purposes. In these cases the quantity will need to be rounded up (or down) to arrive at a billable unit.
For example, suppose a cloud computing service charges based upon the number of hours the customer uses the service during a billing period. Customer A used the service 3 times during the past month for a total of 150 minutes. The usage needs to be converted to hours to calculate the charges. 150 minutes = 2.5 hours, which is 3 hours after rounding up.
Below is an example of a cloud-based media redaction service that blurs faces in videos and images that might be used in news or public safety scenarios. The pricing is based upon the length of the video file playback. As you can see in the fine print, the file length is rounded up to the nearest minute for billing purposes. Note, that there is a minimum billable unit of one minute.
For additional details about the specific example of rounding for billable unit calculation see the Azure Media Redactor page.
Many SaaS and cloud providers differentiate their offering by categorizing certain types of usage as non-billable. In these cases, the usage-based billing systems will need to be able to identify non-billable usage and excluded it from quantity calculations.
Consider an example of an email service provider whose pricing is based upon the number of messages sent to customers. Suppose that the email service also has the option to carbon copy (cc) employees on the messages to customers. The email service provider might decide that the messages sent to employees are non-billable units and only charge for customer-facing transactions.
Below is an example of pricing for a virtual private cloud. The unit of measure is GB of data transferred, but the price can vary by the destination location. Note that only data transferred out of the cloud (egress) is billable and that data transferred in (ingress) is non-billable.
For additional details on the specific example of non-billable units shown above consult the Google Virtual Private Cloud pricing page.
Some SaaS and cloud providers offer entitlements to customers to incentivize usage of the product. A common entitlement is to include a certain quantity of free or included units each month at no additional charge. These free/included units need to be deducted from the actual consumption data before the rating process occurs.
For example, a computer vision application might include 100 image recognition scans per month at no charge for customers on annual contracts. If the customer only performs 150 scans this month they will only be charged for 50 billable units (and not the first 100 free units).
Below is an example of a freemium pricing table for an infrastructure-as-a-service cloud platform. The table shows the quantity of usage that can be consumed each month at no charge on the platform. The free units vary by product and each have different value metrics.
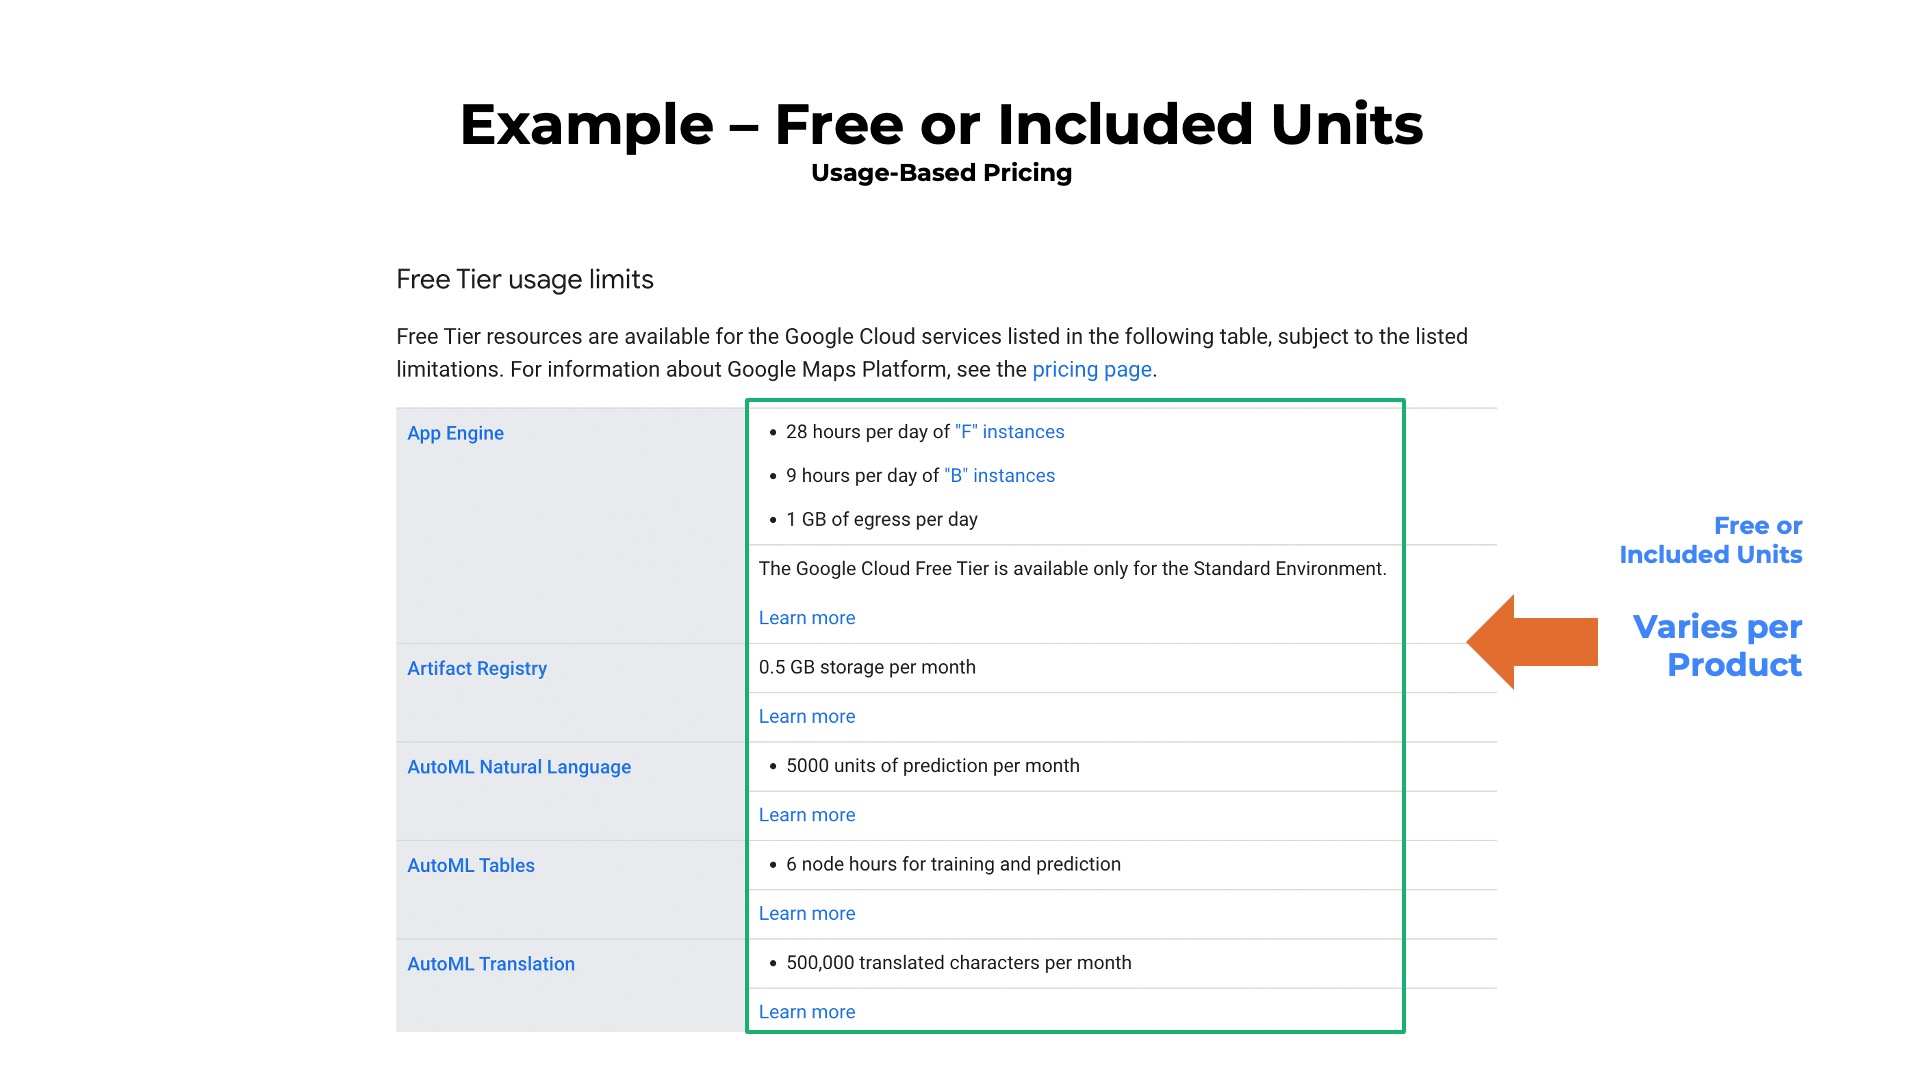
To see the complete list of free units included in the specific example above visit the Google Cloud free cloud features page.
With pre-processing completed, the quantity calculations can then be performed. The process typically involves performing some simple mathematical operations to arrive at the billable usage quantity.
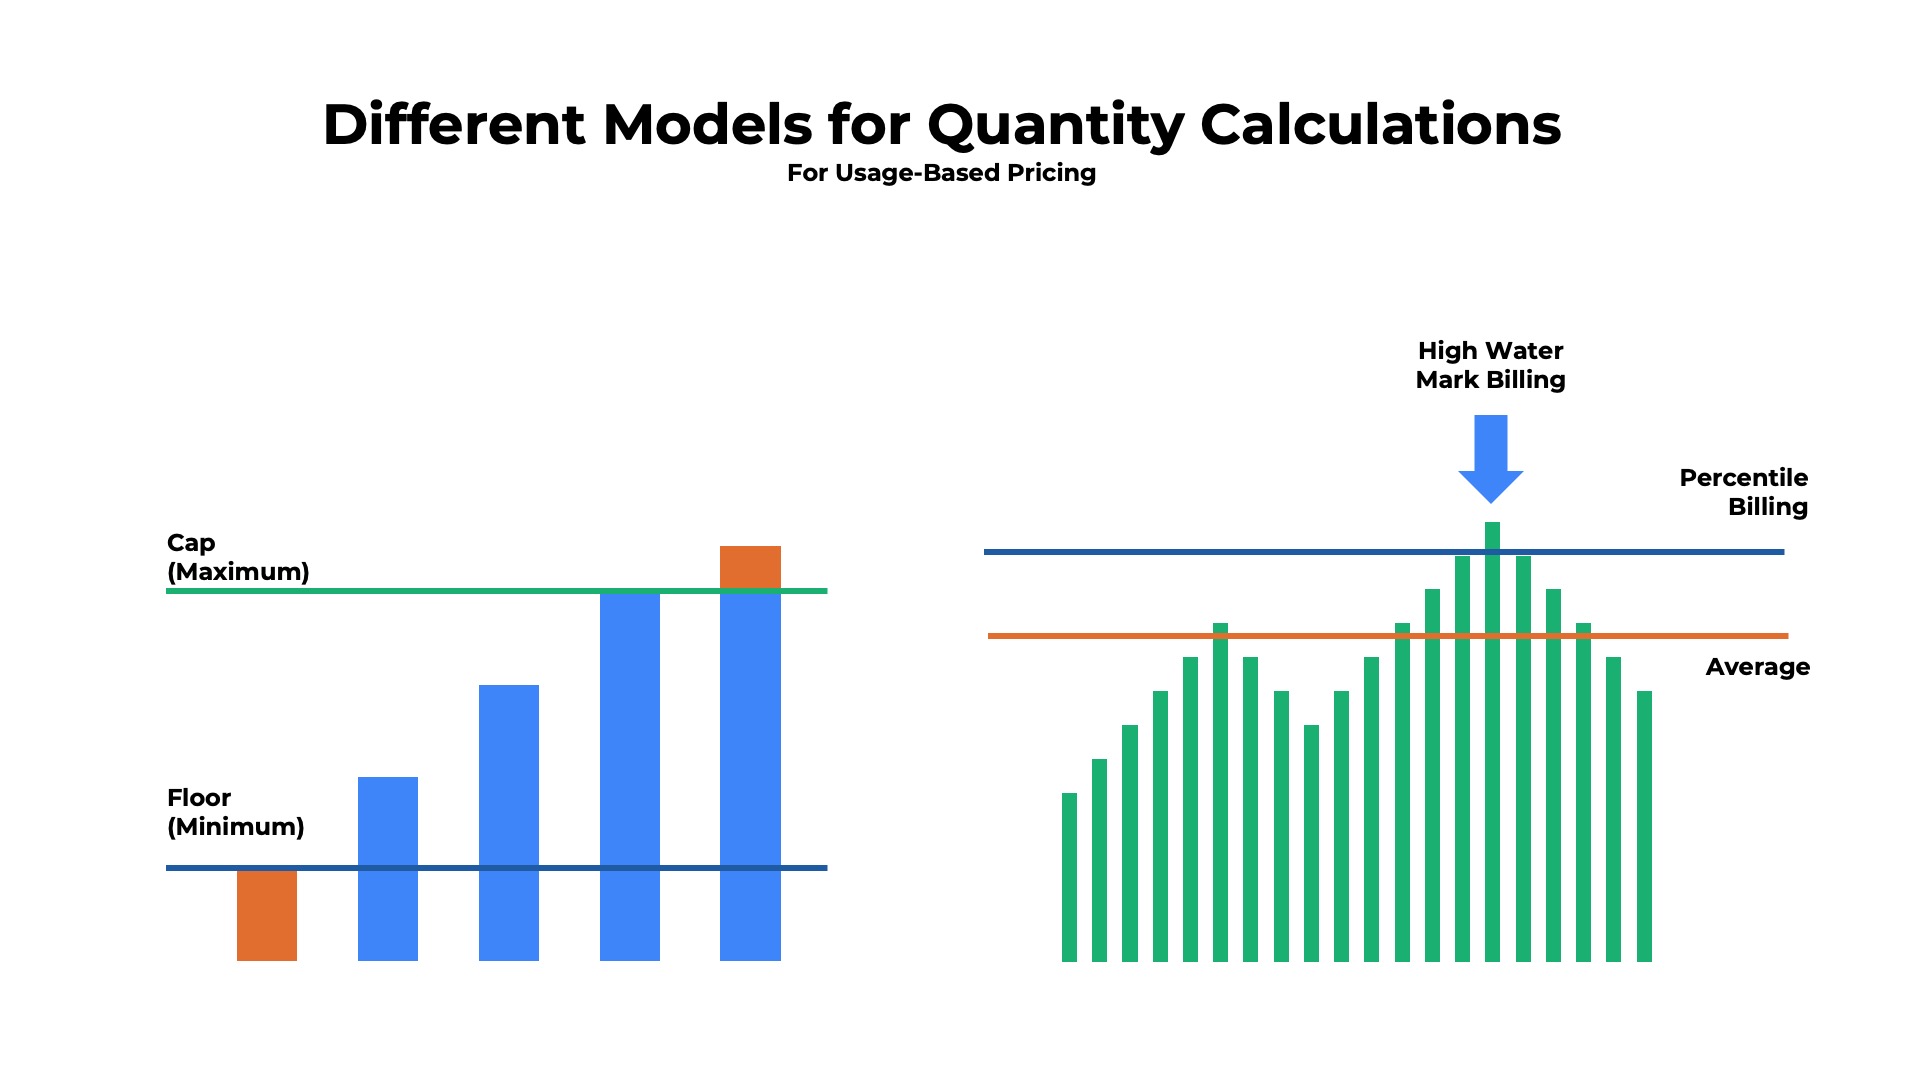
The customer is charged based upon the maximum level of usage attained during the billing cycle. This billing model is often referred to as the “high water mark” approach. The SaaS or cloud application will need to collect a set of samples – metering the level of consumption at regular intervals such as once per hour. At the end of the billing period the usage readings would be sorted max to min to identify the peak used as the billing quantity.
For example, suppose a cybersecurity provider charges based upon the number of endpoints (PCs, mobile phones, network elements) that it is monitoring and managing. Once per day at Noon GMT, the cybersecurity application meters the number of devices connected for each account. At the end of the month, the billing system reviews the samples for each customer and identifies the peak meter reading for each account (e.g. 94 endpoints on day 14). The peak usage, or high water mark, is the billable usage quantity for the month.
Real World Example
Below is an example of a variant of a high water mark plan. In the explanation of the billing methodology the provider explains how the quantity calculation is performed each month. In this example, the eighth highest measurement (rather than the highest measurement) is used.
For additional details on the example high water mark plan shown above visit the DataDog pricing page.
The customer is charged based upon the 90th, 95th, or 99th percentile of usage during the period. In the percentile model, usage is sampled at a regular frequency throughout the billing cycle. At the end of the period, the samples are all aggregated and the top n% of meter readings are discarded. In the 90th percentile the top 10% would be eliminated. In the 95th percentile, the top 5% would be eliminated. In the 99th percentile, the top 1%. Percentile billing is popular in networking services where irregular traffic spikes can occur that are not indicative of the usage profile of the customer.
For example, suppose a cloud computing platform bills for network traffic in and out of its data center using a 95th percentile billing model. Samples of data transfer rates are performed 1000 times during the month. During the billing run, the samples for each customer are reviewed and sorted from highest to lowest. The top 5% (50) are discarded as outliers and the billable usage quantity is set to be the 950th highest data point (95th percentile).
The simplest and most common approach to calculating the billable usage quantity involves basic addition. First the raw consumption data is sorted by customer and product. Next the total amount of usage for each customer at a product level is counted.
For example, suppose an address verification company prices based upon the number of API transactions that occur per month. In the latest month there are 10M individual API transactions logged across the customer base. The summary count process identifies that 100K API calls were from customer A, 90K from customer B, and 80K from customer C, etc.
Some SaaS and cloud providers will bill their customers based upon the average (or mean) usage level in the period. Usage samples are taken periodically throughout the billing period and captured in a database or log file. At the end of the month, the samples would be averaged to arrived at the quantity to be used in the billing process.
For example, a point-of-sale application provider might bill restaurant chains based upon the average number of store terminals active during the billing period. The metering function might sample the number of active terminals twice per day at 8am and 8pm local time. At the end of the month, the samples for each customer would be averaged to arrive at the billable usage quantity for each account.
Some SaaS and cloud providers might define a billing policy that sets a maximum quantity for which any customer can be billed for during a single period. If the customer’s actual usage surpasses the policy threshold, the quantity used to compute the charges will be set to the cap amount.
For example, suppose a compute-as-a-service charges $2.00 per hour to rent a preconfigured combination of vCPU, memory, and storage. A usage cap of 600 hours is set for the product at which the price is effectively maxed out at $1200, which is the per month price for the same configuration.
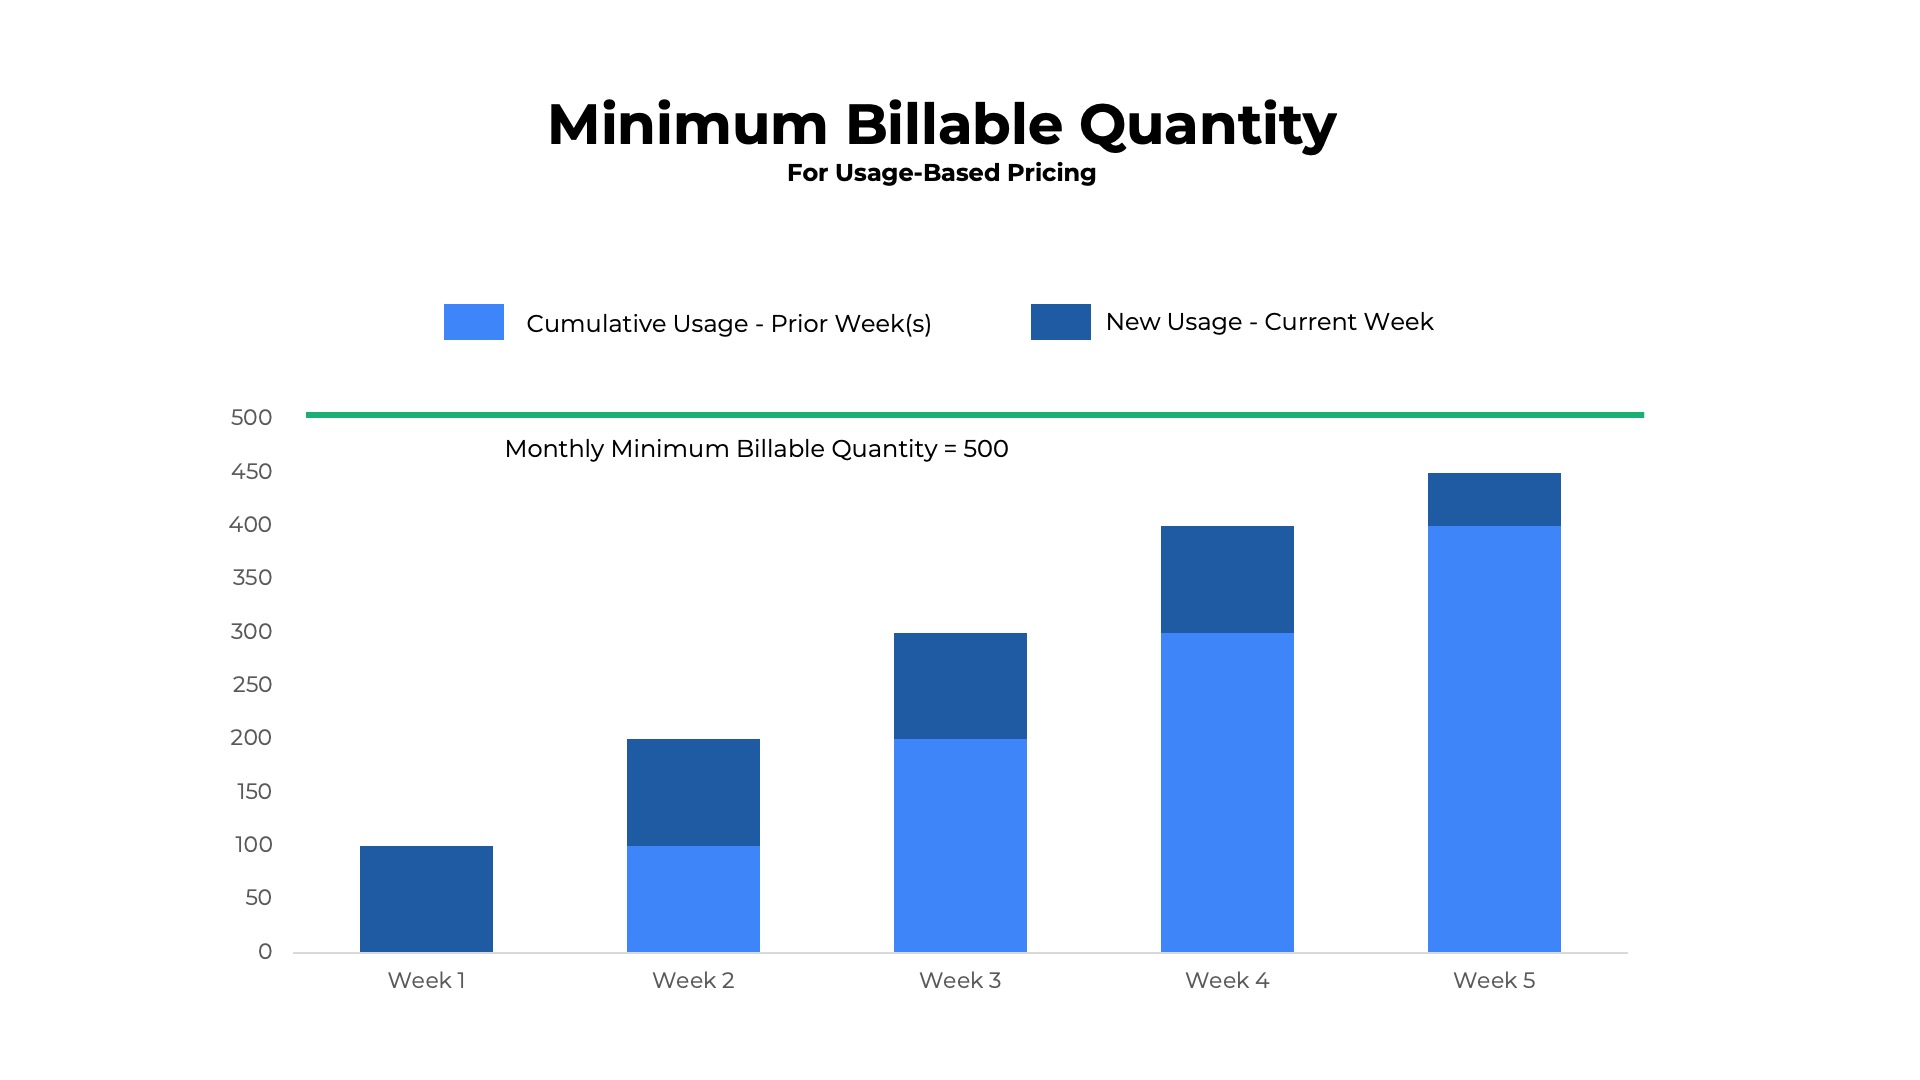
The SaaS or cloud provider might define a floor or minimum for the billable usage quantity. If the customer’s actual usage is below the floor, the quantity used to compute the charges will be set to the floor amount.
For example, suppose a fraud detection company charges $1.00 for each e-commerce transaction it inspects. The company has a billing policy that sets a usage floor of 10 transactions per month. If a customer performs 11 or more fraud verification per month the cost will be the actual number of transactions multiplied by the price per unit ($1/transaction). If a customer performs 10 or fewer transactions, they will be billed based upon the minimum quantity of 10.
Additional topics in the guide include:
Overview
Pricing Metrics
Discounting Models
Contract Structures
Packaging Strategies
Presentation Formats
Calculating Quantity
Usage-Based Billing
