Summary
SaaS customer cohort analysis is a vital financial trend used to showcase a company’s ability to expand existing accounts through upsell and cross-sell initiatives. By grouping customers based on their acquisition year and tracking their revenue over several years, this analysis provides a clear visual of net growth, factoring in expansions, contractions, and churn. Investors closely examine these cohort diagrams, often referred to as “layered cake diagrams,” to assess long-term revenue retention and the effectiveness of growth strategies. This deep dive offers real-world examples from publicly traded SaaS companies, illustrating how leading firms demonstrate sustainable customer value.
Key Takeaways
- SaaS customer cohort analysis groups customers by their acquisition year to visualize revenue growth from existing accounts over time.
- Investors heavily rely on cohort analysis to understand net revenue retention, product attach rates, and overall account expansion.
- The analysis visually depicts the combined effects of customer upgrades, downgrades, and churn within specific customer groups.
- Publicly traded SaaS companies frequently include cohort analysis in S-1 filings and investor presentations to demonstrate long-term growth potential.
- Different companies may use varying metrics, such as GAAP subscription revenue or Annual Recurring Revenue (ARR), and lookback periods for their cohort reporting.
The Importance of SaaS Customer Cohort Analysis
Customer cohort analysis is one of the financial trends that SaaS companies commonly present to demonstrate their ability to grow existing accounts over time with upsell and cross-sell activities. Customers are grouped into cohorts based on the year they first purchased services from the SaaS provider. The revenue generated from each cohort is measured separately over a period of time typically ranging between three and seven years. Cohort analysis can be depicted visually in many different ways but the most common approach is to use a surface graph, which is sometimes informally referred to as a layered cake diagram.
Investors use cohort analysis to understand how groups of customers are growing over time along with other SaaS metrics such as product attach rates, net revenue retention, gross revenue retention, and ARR expansion rates. In any given cohort there will be some customers that expand (upgrade) their use of the SaaS companies services and others that contract (downgrade) or churn (cancel) the service. A cohort analysis helps investors visualize the net effects of the expansion minus the contraction and the churn.
SaaS Customer Cohort Analysis Examples
Customer cohort analysis is typically presented by SaaS companies in the S-1 registration statements that are submitted to the SEC prior to an IPO. It is rare for cohort analysis to be included in the on-going quarterly (10-Q) and annual (10-K) reports that public companies issue, however, many do include these charts in the associated presentations shared on quarterly earnings calls or investor days.
Appian Customer Cohort Analysis
Appian is a publicly traded SaaS company that provides companies with tools to automate and orchestrate businesses processes. In its S1 filing, the company showed a bar chart diagram of customer cohort analysis with a six year lookback period. Appian’s customer cohort analysis only included its recurring GAAP “subscription revenue.”
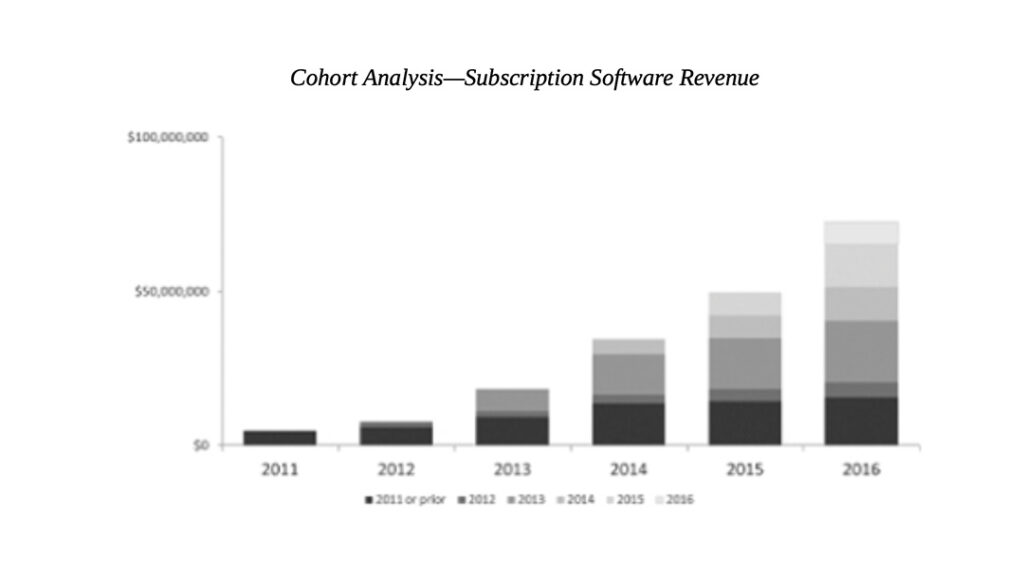
“We focus on acquiring new customers and growing our relationships with existing customers over time. The chart below illustrates our history of attracting new customers and expanding our revenue from them over time as they realize the benefits of building applications using our software.
The chart reflects annualized subscription revenue for the group of customers that became our customers in each respective cohort year. For instance, the 2013 cohort includes all customers whose contract start date was between January 1, 2013 and December 31, 2013. Annualized subscription revenue is the total amount of monthly subscription revenue for that applicable customer cohort in January of the following year multiplied by 12. We use January revenue data for the cohort of customers who first signed subscription agreements in the preceding year because January is the first month in which we are earning a full month of revenue from all such customers. Our annualized subscription revenue for the year ended December 31, 2016 for our 2013 customer cohort represented a 2.8 times increase over the annualized subscription revenue for the year ended December 31, 2013 for that 2013 customer cohort. Building upon this success, we believe a significant opportunity exists for us to acquire new customers as well as expand the use of our platform by increasing the number of users within our current customers’ organizations.”
Read Appian’s 2017 SEC S-1 registration form to better understand how the company tracks annualized subscription revenue and customer cohort expansion.
BlackLine Customer Cohort Analysis
Blackline is a publicly traded SaaS company that sells into the office of the CFO. The company’s software helps large enterprises and middle market organizations to automate their financial close and accounting processes. In its IPO registration filing with the SEC, the company shared a customer cohort analysis for its subscription and support (GAAP) revenue with a five-year lookback period. Note, the calculation approach used by BlackLine to report cohort revenue in the initial and subsequent years.
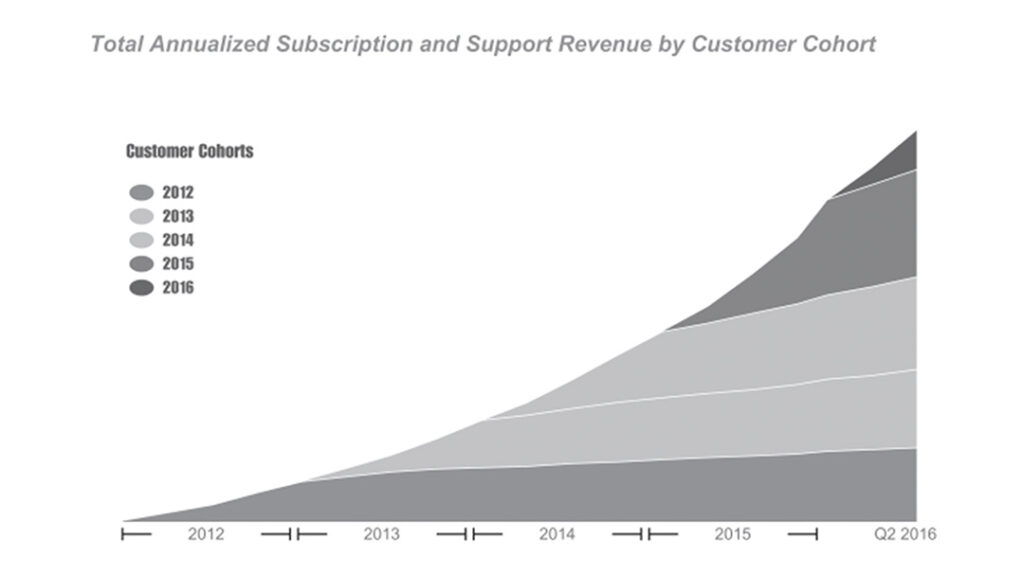
“We employ a land-and-expand sales strategy that focuses on efficiently acquiring new customers and growing our relationships with existing customers over time. As the chart below illustrates, we have a history of attracting new customers and expanding their revenue with us over time. Building upon this success, we believe significant opportunity exists for us to acquire new customers in both the enterprise and mid-market segments across all geographies, as well as expand the use of our platform by selling additional products and increasing the number of users within our current customers’ organizations.
The chart reflects annualized subscription and support revenue for the group of customers that became our customers in each respective cohort year. A “cohort” is a grouping of customers by the year specified. For instance, the 2012 cohort includes all customers whose contract start date is between January 1, 2012 and December 31, 2012. We calculate annualized subscription and support revenue at a particular date as the total amount of minimum subscription and support revenue contractually committed under each of our customer agreements for that month through the remaining term of the agreement, divided by the remaining number of months in the term of the agreement, multiplied by twelve.”
Read BlackLine’s SEC S-1 registration form to better understand how the company reports on subscription and support revenue as well as customer cohort analysis.
Confluent Customer Cohort Analysis
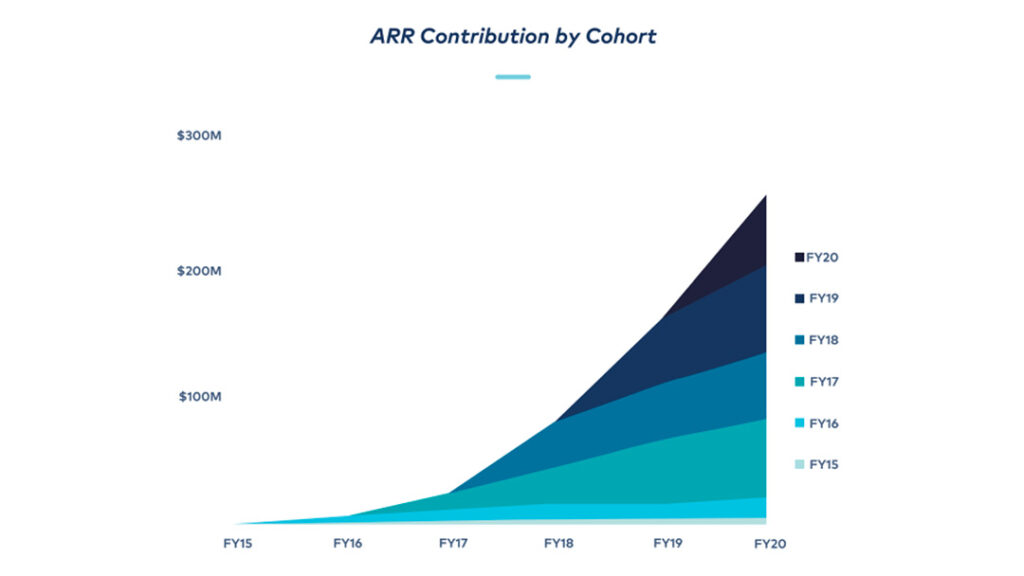
“We have historically experienced significant expansion. The chart below illustrates this by presenting the ARR from each customer cohort over the years presented. The cohort for a given year represents customers that acquired their initial subscription purchase from us in that year. For example, the fiscal year 2017 cohort represents all customers that made their initial subscription from us between January 1, 2017 and December 31, 2017.”
Read Confluent’s IPO registration form S-1 to better understand how the company reports on customer cohort analysis growth over time.
DataDog Customer Cohort Analysis
DataDog is a publicly traded cloud provider that provides observability and security services to its customers. regularly reports its customer cohort analysis to investors. In the chart below from its S-1 registration statement, the company shares the prior seven years of cohorts in a layer cake diagram. DataDog measures cohort growth in terms of ARR and does include non-contracted revenue from monthly plans and usage fees.
Also, noteworthy is that DataDog also tracks its Top 25 customers as a separate cohort.
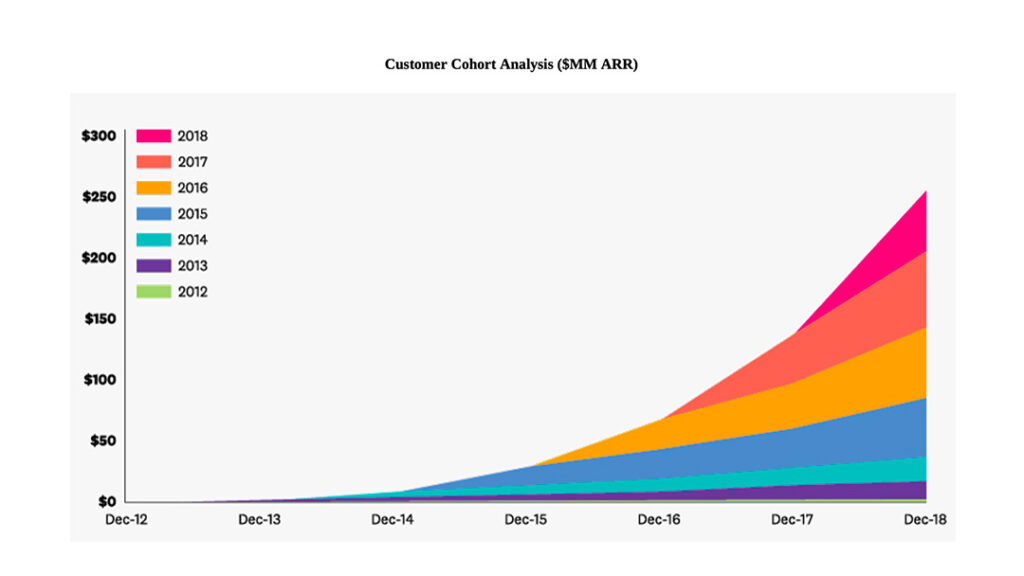
“Once our platform is deployed we have experienced significant expansion historically, with customers engaging with our customer success team as well as increasing usage and spend in a self-serve manner.
The chart below illustrates this expansion by presenting the ARR from each customer cohort over the years presented. We define ARR as the annual run-rate revenue of subscription agreements from all customers at a point in time. We calculate ARR by taking the monthly run-rate revenue, or MRR, and multiplying it by 12. MRR for each month is calculated by aggregating, for all customers during that month, monthly revenue from committed contractual amounts, additional usage and monthly subscriptions.”
Read DataDog’s S-1 registration form with the SEC to better understand how the company calculates ARR and reports on customer cohort growth.
Dropbox Customer Cohort Analysis
Dropbox is a publicly traded cloud company that enables individuals and teams to store files and share information. The company groups cohorts based on the quarter the customer was acquired (versus the year). Dropbox tracks growth of MRR for each cohort.
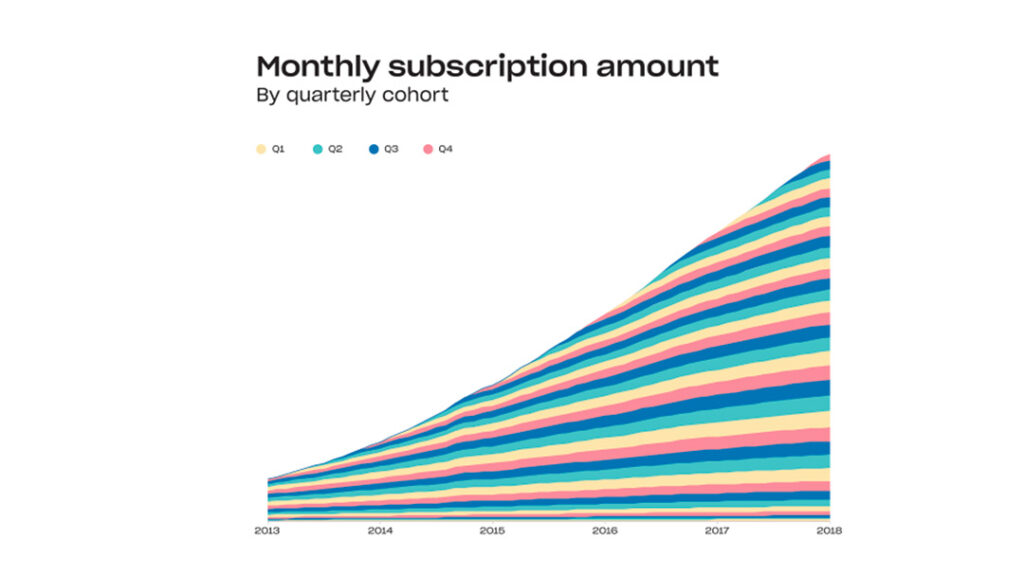
“We define a cohort as all registered users who signed up for Dropbox in a given period of time. We track the total monthly subscription amount of all paying users in each cohort as of the end of the month, or the monthly subscription amount. For paying users who opt for our monthly plans, the monthly subscription amount is equal to the price of the monthly plan. For paying users who opt for our annual plans, which a majority of our users do, the monthly subscription amount is equal to the price of the annual plan divided by twelve.”
Read Dropbox’s S-1 registration filing with the SEC to better understand the company’s business model and how it grows customer relationships.
Fiverr Customer Cohort Analysis
Fiverr is a digital marketplace that connects businesses with freelance professionals to provide graphic design, web development, search engine optimization, and video creation. The company is publicly traded on the NYSE. In its IPO filing, Fiverr presented customer cohort analysis for the prior 14 years in a layer cake diagram. The company tracks the growth of cohorts using GAAP revenue.
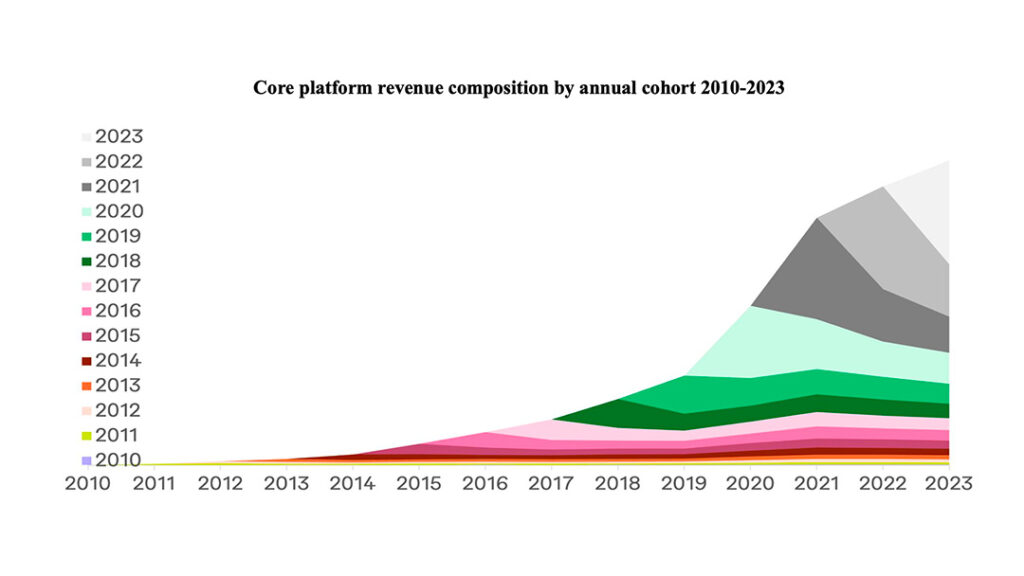
“Historically, we have experienced significant expansion after initial deployment of our products by our customers, with customers expanding usage as well as extending to additional products. The chart below illustrates this expansion and extension by presenting the ARR from each customer cohort over the years presented. We define ARR as the annualized value of all recurring subscription contracts with active entitlements as of the end of the applicable period, and in the case of our monthly, or consumption-based customers the annual value of their last month’s spend. The cohort for a given year represents customers that acquired their initial subscription from us in that fiscal year.”
Read Fiverr’s F-1 registration filing with the SEC to better understand how the company measures SaaS metrics like ARR and performs customer cohort analysis.
HashiCorp Customer Cohort Analysis
HashiCorp is a cloud company that helps its customers manage the security and infrastructure lifecycle for multi-cloud and hybrid operating environments. HashiCorp tracks the growth of its customer cohorts’ annual recurring revenue (ARR). In the company’s S-1 registration statement, HashiCorp presented a cohort analysis for its customer ARR growth over the prior five years. Note that HashiCorp includes monthly plans and usage-based fees in its definition of ARR.
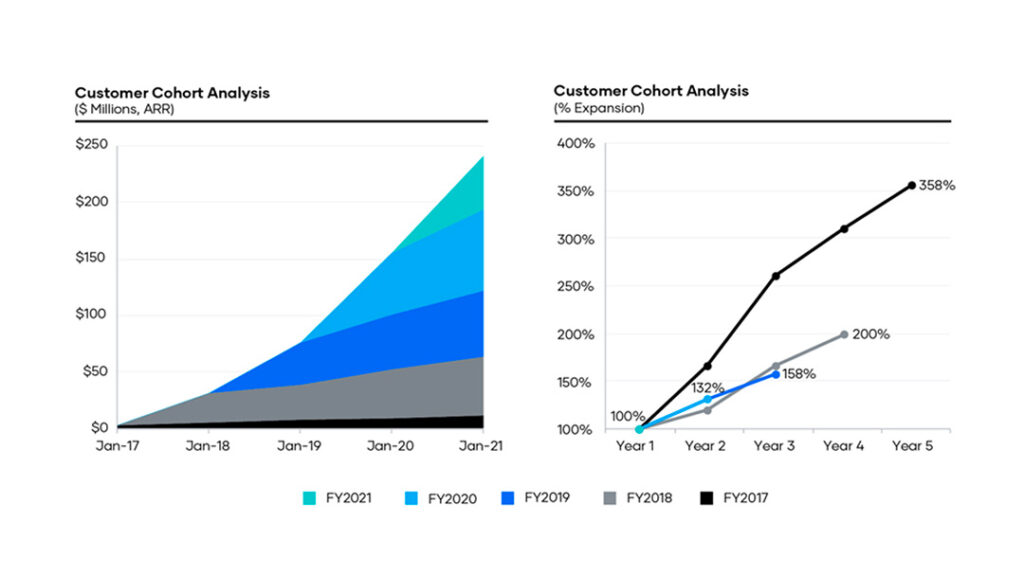
“Historically, we have experienced significant expansion after initial deployment of our products by our customers, with customers expanding usage as well as extending to additional products. The chart below illustrates this expansion and extension by presenting the ARR from each customer cohort over the years presented. We define ARR as the annualized value of all recurring subscription contracts with active entitlements as of the end of the applicable period, and in the case of our monthly, or consumption-based customers the annual value of their last month’s spend. The cohort for a given year represents customers that acquired their initial subscription from us in that fiscal year.”
Read HashiCorp’s SEC IPO registration form S-1 to better understand how the company tracks expansion ARR and the growth of customer cohorts.
SEMRush Customer Cohort Analysis
SEMRush provides a suite of marketing technology applications that help its customers perform search engine optimization, pay-per-click ads, and social media campaigns. The company tracks growth of its recurring “subscription” revenue for its customer cohorts. In the SEMRush’s S-1 registration form with the SEC, it shared six years of cohort data in the layer cake diagram below:
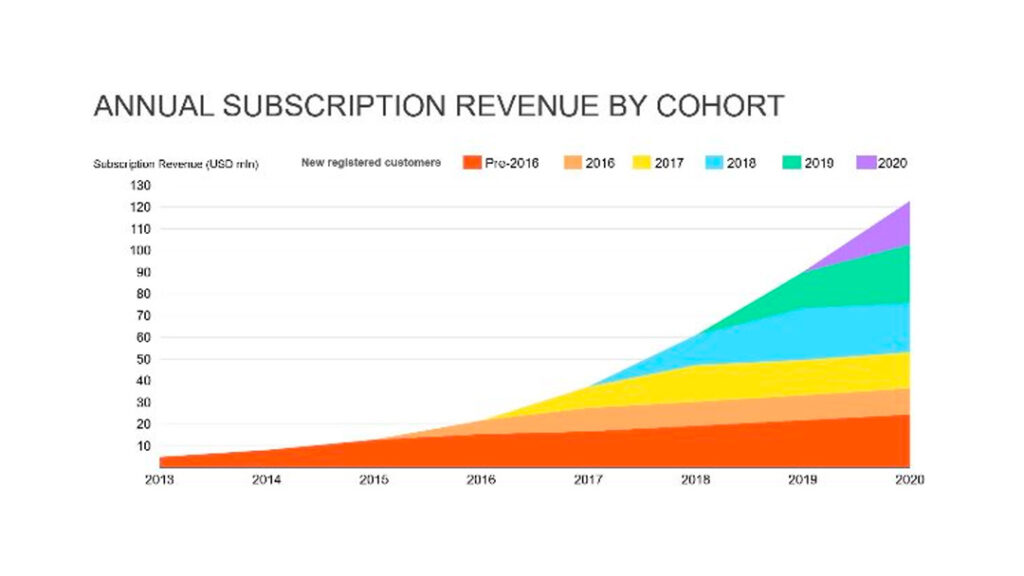
“Our sales team is largely focused on driving account expansion by encouraging our customers to fully recognize the potential benefit from our comprehensive platform. As a result, we have become increasingly efficient at acquiring customers who increase their spend with us over time. The chart below illustrates the subscription revenue from each customer cohort based on the year in which they became customers during the year presented. As indicated in the chart, our customer cohorts typically experience their lowest dollar-based net revenue retention rate during their second full year after becoming a customer, after which the dollar-based net revenue retention rate typically improves and we are able to drive increased spending across the remaining customers within the cohort.”
Read SEMRush Holdings S-1 registration filing to better understand how they grow their install base and measure SaaS metrics like net revenue retention and customer cohort analysis.
Shopify Customer Cohort Analysis
Shopify is a Canadian e-commerce platform company that enables small businesses to run online stores and retail operations. The company regularly shares cohort analysis for its community of merchants (customers) with its investors. In a recent 20-F filing, Shopify presented the growth of four customer cohorts GAAP revenue (vs ARR) using the bar chart diagram below.
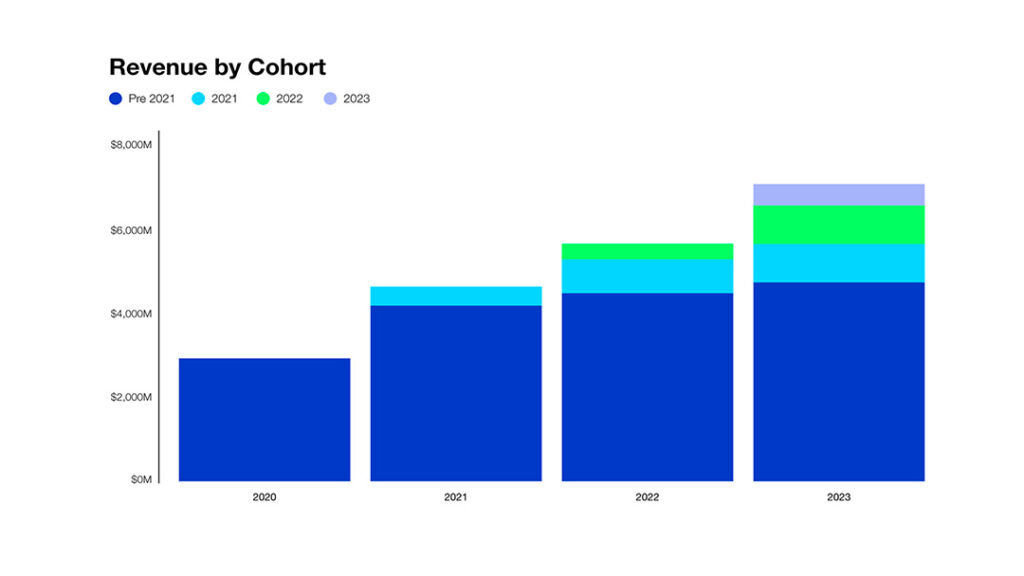
“As our merchants grow their sales and become more successful, they typically consume more of our merchant solutions, upgrade to higher subscription plans, and purchase additional apps. We consider our merchants’ success to be one of the most powerful drivers of our business model. The chart below displays the annual revenue for merchant cohorts that joined the Shopify platform at different times in our history. The strength of our business model lies in the consistent revenue growth generated from each cohort and historically, any declines in revenue we experienced from merchants leaving our platform were more than offset by increases in revenue from remaining merchants. Over time, revenue generated by our cohorts has continued to increase as merchants grow with Shopify and take advantage of the expanding capabilities of our platform.
For example, revenue from our pre-2021 cohort expanded in 2022, as the revenue impact from merchants within the cohort leaving the platform was offset by revenue growth from remaining merchants within that cohort. In 2023, revenue from the pre-2021 cohort continued its growth as merchant retention improved, and the remaining merchants increased their gross merchandise volume and adopted additional solutions provided through the Shopify platform.”
UiPath Customer Cohort Analysis
UiPath is a publicly traded SaaS company listed on the NYSE. It provides robotic process automation and AI-powered agents to customers around the world. UiPath presented seven years of ARR growth from its customer cohorts in its IPO filing with the SEC. UiPath calculates ARR by taking the last month’s GAAP revenue and annualizing it. Also, noteworthy is that UiPath tracks the growth in its Top 50 customer cohort as well.
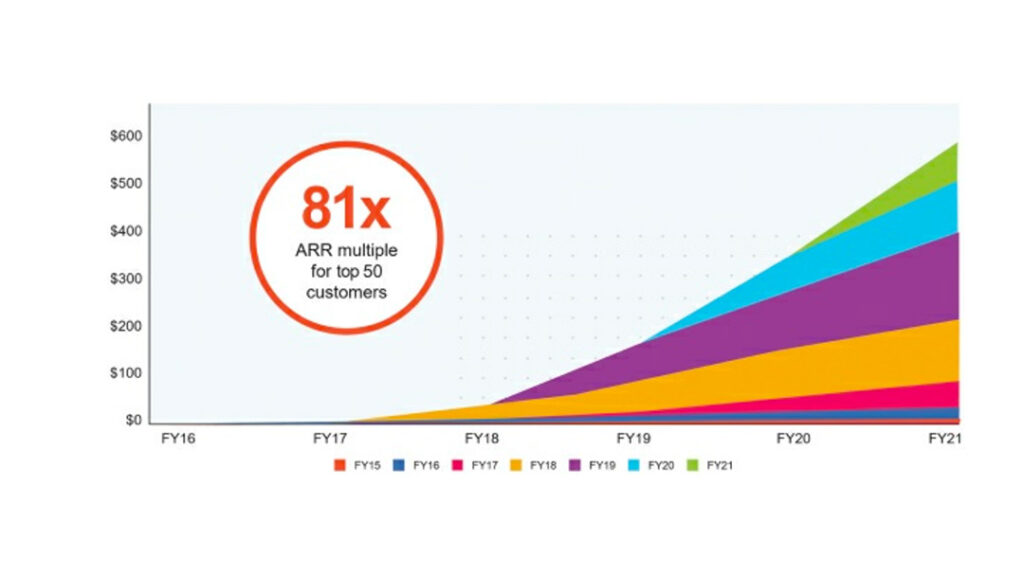
“The chart below illustrates this expansion by presenting the ARR from each customer cohort over the years presented. Each cohort represents customers that made their initial purchase from us in a given fiscal year. For example, the 2016 cohort includes all customers that had their initial purchase within the fiscal year 2016. This cohort increased their ARR from $395,368 as of January 31, 2016 to $22.7 million as of January 31, 2021, representing a multiple of approximately 57x since fiscal year 2016. Additionally, the ARR from our top 50 customers as of January 31, 2021 increased by a median multiple of approximately 81x, as measured from the ARR generated in each such customer’s first month as a customer.”
Read UiPath’s S-1 IPO registration filing to better understand how they calculate ARR and measure customer cohort growth.
Upwork Customer Cohort Analysis
Upwork is an online marketplace that connects freelance professionals around the world with businesses seeking outside help. Professionals on Upwork offer a variety of services ranging from writing and content marketing to graphic design and website development. Upwork tracks the growth of GAAP revenue for its customer cohorts. In the company’s IPO filing with the SEC, it presented nine years of cohort data in the bar chart below:
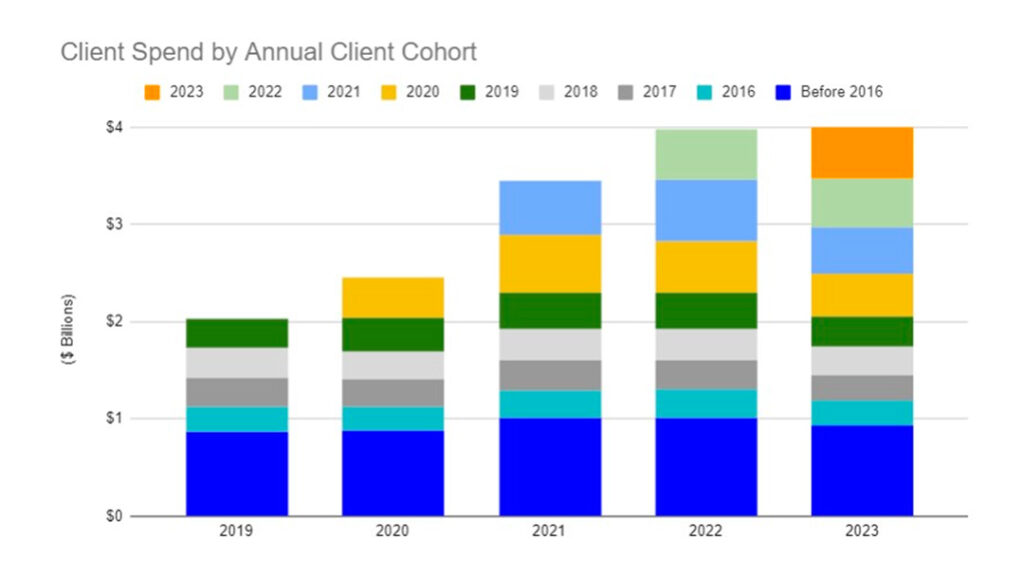
“Our growth has been driven, in significant part, by retaining client spend from existing clients as we grow our client base. As illustrated in the chart below, we have been able to retain client spend over long periods of time with clients in historical cohorts continuing to spend meaningfully on our work marketplace. A client belongs to an annual cohort based on the date of first spend activity with talent. For example, the 2023 cohort includes all clients that had their first spend activity with talent between January 1, 2023 and December 31, 2023.”
Read Upwork’s SEC S-1 registration filing to learn more about how they track customer growth and perform cohort analysis.
Yext Customer Cohort Analysis
Yext is a SaaS provider that helps its customers manage the digital presence of their various locations. With Yext, customers can manage their online reviews and reputation as well as local SEO. The company tracks the growth in GAAP revenue for its enterprise and middle-market customers. In its S1 SEC filing, the company shared three years of historical cohort analysis in the bar chart below. Note, that SMBs were excluded from the analysis.
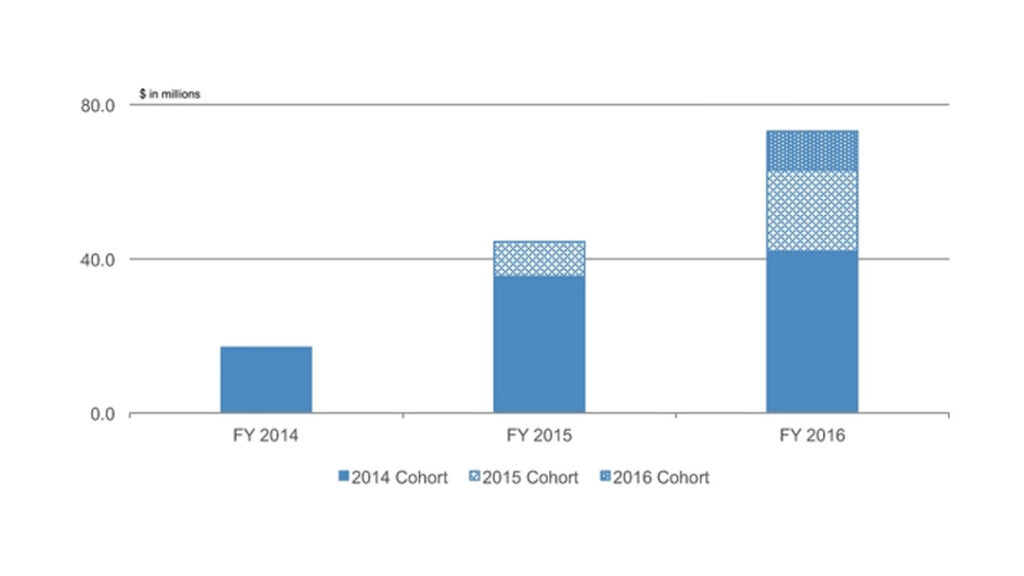
“The chart below shows the total revenue from each cohort over the periods presented. Each cohort represents the period in which revenue was first recognized from a customer making their initial purchase. For example, the fiscal year 2015 cohort represents revenue recognized from customers whose initial subscription commenced between February 1, 2014 and January 31, 2015. The fiscal year 2015 cohort increased their revenue from $9.2 million in fiscal year 2015 to $21.3 million in fiscal year 2016, growing by 131% over that period. We only consider revenue from enterprise and mid-size customers and reseller customers in this analysis since small businesses have limited locations and inherently high turnover.”
Read Yext’s SEC S-1 registration filing to learn more about their business and how they track expansion of customer cohorts.
ZipRecruiter Customer Cohort Analysis
ZipRecruiter is online talent marketplace that matches job seekers with prospective employers using AI technologies. The company regularly reports its average monthly revenue per paid employer by employer cohort in its SEC filings and investor presentation materials. In the line chart below, ZipRecruiter shares the growth in its employer cohorts over a six year period.
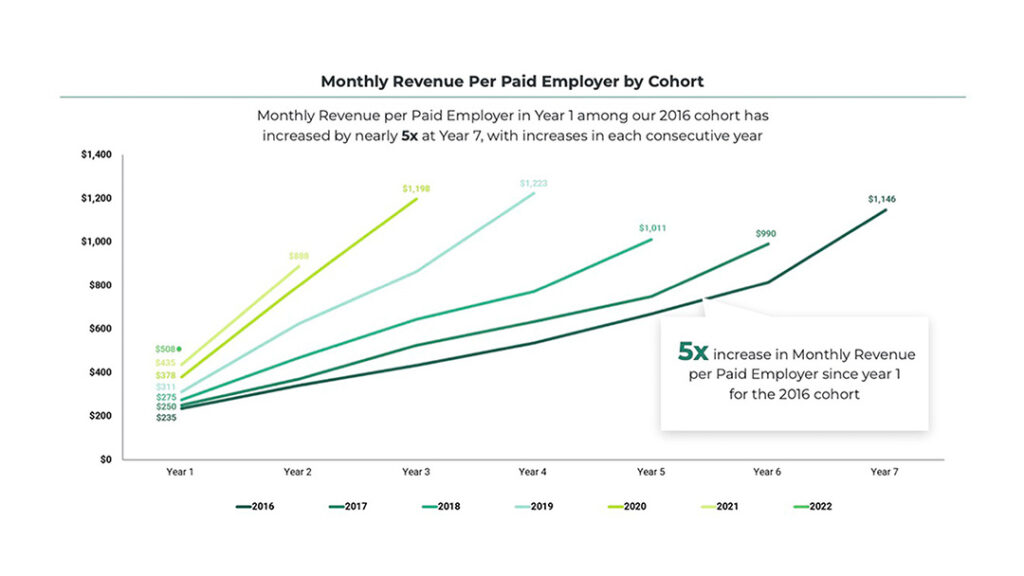
Average Monthly Revenue per Paid Employer by Employer Cohort Start Year
“Satisfied employers continue to expand their relationship with us in terms of additional jobs and tenure in our marketplace. Those with recurring hiring needs remain active in our marketplace over time and tend to increase their spend each year, posting additional jobs and purchasing job enhancement products.
Despite the impact on employer hiring demand, our cohort trends remained intact: employers across annual cohorts continue to spend more over time. However, the more difficult hiring environment in 2023 did slow down the rate of growth in Average Monthly Revenue per Paid Employer among prior cohorts. We see these disruptions to the long term cohort dynamics as temporary, driven by the unique slowdown in hiring particularly among larger customers. Over the long-term, we continue to believe that there is meaningful opportunity to grow revenue from large customers.”
Conclusion
Understanding SaaS customer cohort analysis is indispensable for any company aiming for sustainable growth and for investors evaluating long-term potential. By meticulously tracking how customer groups evolve over time, businesses gain crucial insights into the effectiveness of their land-and-expand strategies, product-market fit, and overall customer value proposition. The diverse real-world examples underscore that while methodologies may vary, the core principle of demonstrating consistent customer expansion remains a cornerstone of robust SaaS performance.
Frequently asked questions
What is cohort analysis in SaaS?
Cohort analysis groups customers by a shared attribute (e.g., signup month) to measure retention, revenue, and churn over time for clearer performance insights.
Why is cohort analysis important for SaaS growth?
It reveals how product changes, pricing, or onboarding impact specific customer groups, helping optimize retention, LTV, and payback by segment.
What types of cohorts work best in SaaS?
Common cohorts include acquisition month, plan/tier, acquisition channel, geography, and product use-case or ICP.
Which metrics should I track in a cohort table?
Track logo retention, gross/net dollar retention, churn rate, MRR/ARR by cohort, expansion/contraction, ARPA, and payback period.
How do I get started with cohort analysis?
Define the cohort key (e.g., signup month), pick intervals (monthly/quarterly), build a cohort table, visualize retention curves, and iterate with consistent definitions.
You May Also Like
 SaaS Gross Revenue Retention Calculation Examples
SaaS Gross Revenue Retention Calculation Examples
 Five Ways to Grow Expansion ARR
Five Ways to Grow Expansion ARR
 RPOs for Usage-Based Pricing


